Formula Data Analysis

16.3K posts

Formula Data Analysis banner
Formula Data Analysis

Formula Data Analysis

@FDataAnalysis

| 📖F1 Understanding Starts by Clicking Follow! | 📈Learn To Read F1 Telemetry Data | ⚙️ Motorsport Performance Engineer / Motorcycle Dynamics PhD |

Turn Notifications On! 🔔 Katılım Mart 2022
1.5K Takip Edilen223.8K Takipçiler
Sabitlenmiş Tweet
Formula Data Analysis
Formula Data Analysis@FDataAnalysis·
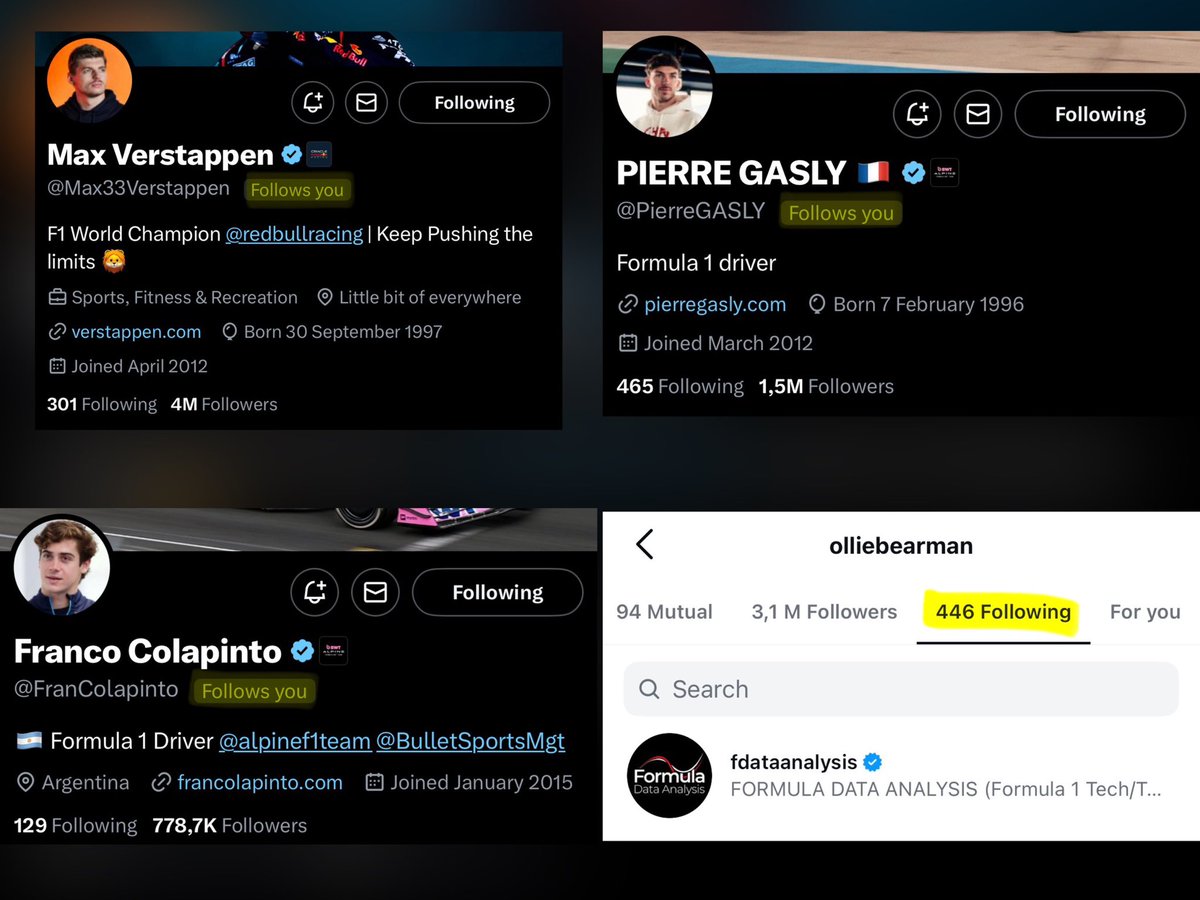
It was shocking to realise that 20% of the current #F1 grid is following my page! 🤯 (4 out of 20) 
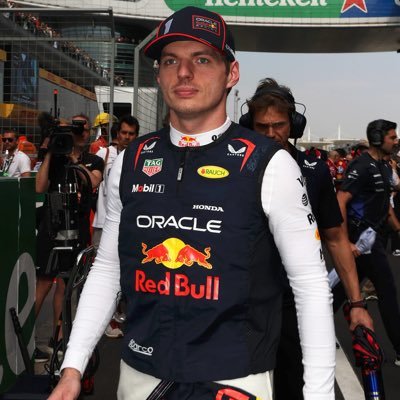
Verstappen was the first to do so (in 2022), and since then he’s always won the WDC! The power of data analysis? 🤣👀 @Max33Verstappen @FranColapinto @PierreGASLY
Formula Data Analysis tweet media
English
54
59
4K
481.5K
Formula Data Analysis
Formula Data Analysis@FDataAnalysis·
RACE PACE #MiamiGP 📊 BEST PACE: ANT, NOR Race decided by ANT's 1-lap earlier pit and clean overtake, not by differences in pace FAST PACE: PIA, LEC LEC almost matched PIA before the issue (analysis coming tomorrow!) SLOWER: RUS, HAM, VER HAM had extensive bodywork damage VER did 51L on a Hard set RUS had no excuses (while ANT carried the team) #F1
Formula Data Analysis tweet media
English
23
106
1.2K
108.5K
Formula Data Analysis
Formula Data Analysis@FDataAnalysis·
Gap to the leader for all the non-lapped cars Notice how much VER’s pace dropped off in the second stint due to the early pit!
Formula Data Analysis tweet media
English
2
5
96
12.8K
VAYU PUTRA
VAYU PUTRA@TrisonicFoxbat·
@FDataAnalysis McLaren has the chance to battle for a win. And I think Max can do so. What do you say
English
1
0
3
1.5K
Formula Data Analysis
Formula Data Analysis@FDataAnalysis·
SPRINT PACE “The break was so long we got back to last year’s Miami Sprint!” The updated 🟧McLaren returned to race-winning pace, while 🟦RBR is in the mix again 🟩Mercedes' pace was only the THIRD quickest (and RUS was no quicker than VER). 🟥Ferrari can be optimistic Pace: 1) McL 0.00 2) Ferrari +0.24 3) Merc +0.35 4) RBR +0.52 5) Alpine +1.39 6) Williams (M/M) +2.14 7) Audi +2.30 8) Haas +2.68 9) RBs +2.79 10) Aston +3.55 11) Cadillac (H) +3.72 YOUR prediction for the #F1 race? 👀
Formula Data Analysis tweet media
English
6
31
398
40.2K
Formula Data Analysis
Formula Data Analysis@FDataAnalysis·
Thanks to slipstream + overtake mode, the two Williams cars hit 351 km/h in the Sprint! SAI averaged 346 km/h, remarkable given that current F1 rules allow almost no ERS deployment at that speed
Formula Data Analysis tweet media
English
1
7
63
12K
Formula Data Analysis
Formula Data Analysis@FDataAnalysis·
Key #F1 SPRINT QUALI notes: •🟥LEC quickest in S1, ⬛️ANT in S2, ⬛️RUS in S3 •🟧McL (NOR) got pole with no purple sectors! •The slowest F1 car (🟩Aston) was slower than the SLOWEST F2 (Shields) •🟥LEC missed power on SQ3 (-6km/h vs SQ2, 0.3s lost vs others!) •Start of 4-teams title fight? 👀
Formula Data Analysis tweet media
English
25
32
582
48K
Formula Data Analysis
Formula Data Analysis@FDataAnalysis·
NOR vs ANT telemetry Notice McL's much stronger deployment before T1 and after T3, which, however, limited their power on the two main straights!
Formula Data Analysis tweet media
English
0
8
85
12.5K
Formula Data Analysis
Formula Data Analysis@FDataAnalysis·
Best sectors: Mercedes and RBR struggled in S1, Ferrari in S2 and S3 (but much less so)
Formula Data Analysis tweet media
English
1
4
83
6.3K
Formula Data Analysis
Formula Data Analysis@FDataAnalysis·
@AgnisRoz They likely had less drag than 2025 cars, but surely more than 2026 ones 2026 F1 cars are likely the least draggy generation of cars since the 80’: they can reach ~350km/h from just a ~550hp ICE (if a long enough straight is available)
English
0
0
7
396
Agnis Rozītis CB42
Agnis Rozītis CB42@AgnisRoz·
@FDataAnalysis Did they really have worse drag? Except for the new straight mode, modern F1 cars are way more draggy than F1 from 50's and 60's. The more power you get, the more drag you can afford to generate more downforce. 1980's cars had about 600hp race trim, they can't be too draggy.
English
2
0
2
518
Formula Data Analysis
Formula Data Analysis@FDataAnalysis·
The most powerful #F1 engine ever? The tiny 1500cc 4-cylinder 1986 BMW M12: over 1400hp in qualifying!🔥 Power is estimated: no dyno could accurately measure over 1000hp!💡 The Benetton reached 352km/h in Monza, with much worse drag (and grip) than current cars! Mind-blowing😳 The inline-4 layout of the BMW engine gave it a clear advantage over the V6 engines used by Ferrari and Renault: 1 fewer turbo, 2 fewer cylinders, 8 fewer valves➡️lower frictional losses➡️More power and better reliability
Formula Data Analysis tweet media
English
16
33
373
21.9K
Formula Data Analysis
Formula Data Analysis@FDataAnalysis·
The most powerful naturally-aspirated #F1 engine ever was... Japanese, likely 🇯🇵 Peak power reached in 2005 (end of 3000cc, 'V10' era) Renault ~900hp Cosworth 915hp Mercedes ~930hp Ferrari 920-940hp Honda >965hp (Last power step in Suzuka) Toyota >1000hp, detuned to ~960hp for reliability The straight-line acceleration of these cars was insane, much higher than the current ones' (and did so 20 years ago!) Compared to current cars: -Similar peak power -Higher end-of-straight power (No ERS, always full power) -200kg lighter (600kg, including driver!) -20cm narrower track, reducing drag Crazy!
Formula Data Analysis tweet media
English
42
120
1.5K
106.8K
Nate Smith
Nate Smith@nws13·
@FDataAnalysis Erm...Mirco...the 2004 engines were more powerful than the 2005 ones. They changed to 1 engine, 1 weekend after
English
2
0
19
3.5K
Formula Data Analysis
Formula Data Analysis@FDataAnalysis·
@StaurosNiarchos Ferrari certainly wasn’t at the top of the power ranking, even though their engine wasn’t bad at all 😁 The rest of the package made the difference, not the engine power itself Toyota’s power was excellent, the car much less so
English
2
0
19
2.1K
Stavros.Niarchos
Stavros.Niarchos@StaurosNiarchos·
@FDataAnalysis I don’t know where you got your numbers from but there was no one anywhere near Ferrari and BMW in the V10 era…let alone Toyota! They couldn’t even beat Renault who were always the lowest in terms of power…
English
1
0
13
2.4K
Formula Data Analysis retweetledi
Formula Data Analysis
Formula Data Analysis@FDataAnalysis·
NEW #F1 ERS RULES (From Miami), EXPLAINED! 📒 Clipping time drops significantly, with minimal impact on lap times and the pecking order. At peak harvest, an F1 car can produce less full-throttle power than a Fiat Panda, but it's for the better 😆 (read to the end!) QUALI • Max recharge: 8 → 7 MJ • Peak superclip power: 250 → 350 kW • Tracks with alternative lower energy limits: 8 → 12 RACE • Boost gain capped at +150 kW • ERS power not on straights: 350 → 250 kW • Peak superclip power: 250 → 350 kW Effects: • Less energy to deploy (7 MJ in quali). Stronger superclipping (250→350 kW) means it lasts even less • Boost mode nerfed, but still enough to overtake • Laptimes roughly unchanged: stronger superclip (↑ perf) offset by less deployment not on straights (↓ perf) Saved the best for last: during superclipping, the PU produces ~400 kW (ICE) − 350 kW (ERS harvest) = ~50 kW (68 hp) at full throttle. That's 1 kW less than a Fiat Panda 1.2 (51 kW)! 🐼
Formula Data Analysis tweet media
English
37
90
969
83.7K