Felito Medina

67 posts

Felito Medina banner
Felito Medina

Felito Medina

@FGMTrading

Stock Trader - - CMT in Training

Utah, USA Katılım Temmuz 2024
3 Takip Edilen14 Takipçiler
Felito Medina
Felito Medina@FGMTrading·
@TechCharts Ok that’s interesting. I will have to give that a look. Will be nice to have a visual. I’ve learned I’m more visual in my approach. I tend to lean towards that. Thank you for that information sir.
English
1
0
0
18
Aksel Kibar, CMT
Aksel Kibar, CMT@TechCharts·
@FGMTrading A subjective approach is to pick an ATR multiple and place that below the pattern boundary. I use the same multiple ATR above the pattern boundary for stop limit entries.
English
1
0
2
73
Aksel Kibar, CMT
Aksel Kibar, CMT@TechCharts·
Pattern negation and stop-loss are NOT the same thing. A pattern negation can be used as a stop-loss. A stop-loss depends on a tactical trading decision. The tighter the stop-loss below the pattern boundary the higher the risk of getting stopped out but also higher the reward/risk if the pattern succeeds. A logical place for a stop-loss is below the pattern boundary once the breakout is confirmed. Stop-loss distance from the pattern boundary CAN NOT be optimized. There is no perfect stop-loss strategy that will keep you in a trade when markets get volatile. It is a trade off you are getting into. You need to either accept higer reward per risk but lower win% or higher win% but lower reward per risk. Choose first one if you are comfortable to be wrong quickly and more frequently in order to have few larger wins.
Aksel Kibar, CMT@TechCharts

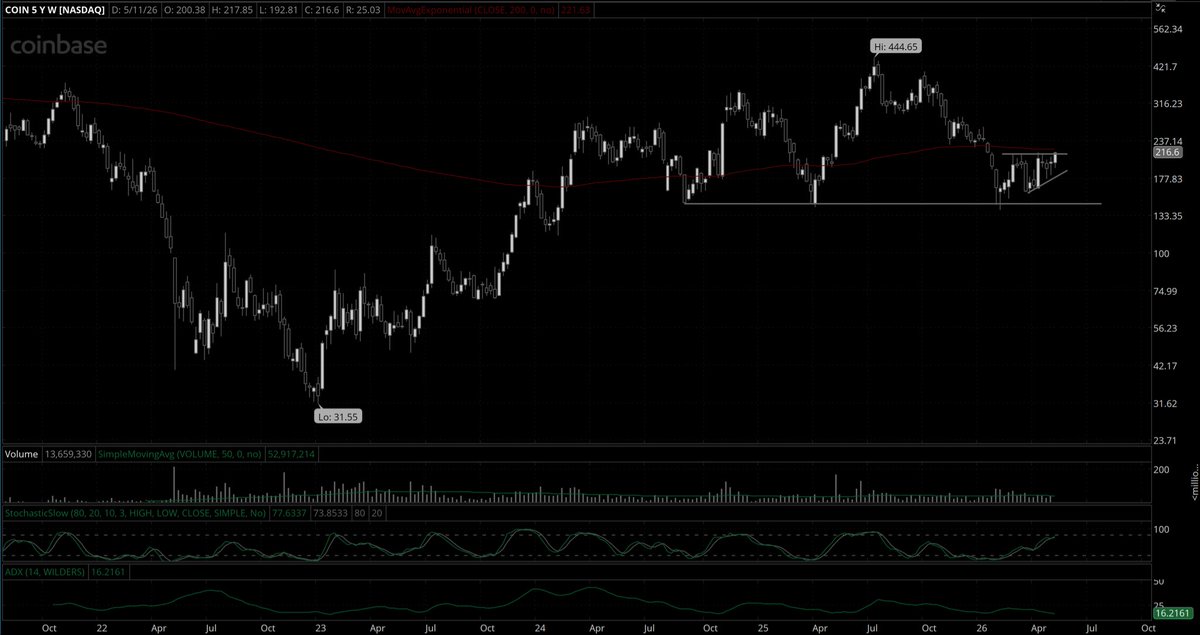
The most annoying type of breakout (Type 3). If it reaches pattern objective it will not negate the pattern but will knock out anyone with a tight stop-loss below the pattern boundary. With short-term setups, I'm one of them... These hesitant price actions around pattern boundary is usually caused by overall market sentiment. At a time when indices lack momentum, stocks that wants to breakout, end up fluctuating around pattern boundary before finding a direction.
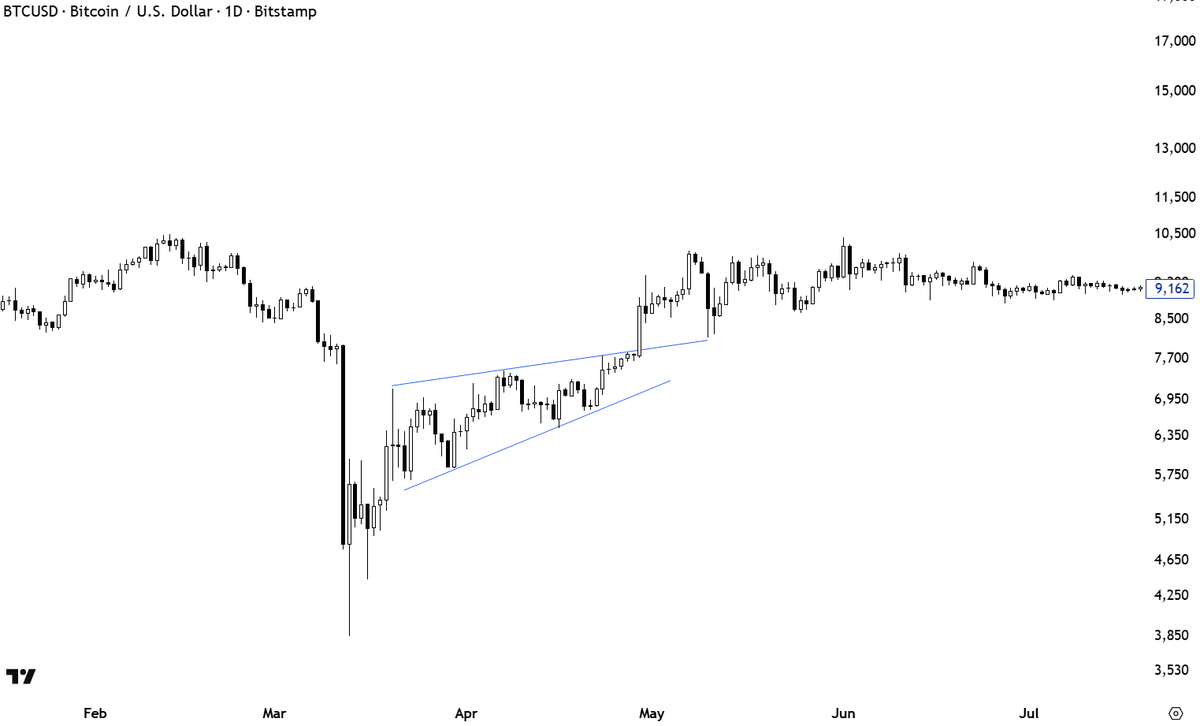
English
5
2
43
10.7K
Felito Medina
Felito Medina@FGMTrading·
@TechCharts Congratulations on the milestone Aksel, genuinely love your work.
English
1
0
2
131
Aksel Kibar, CMT
Aksel Kibar, CMT@TechCharts·
In JUNE Tech Charts will have its 9th year anniversary. We are planning a private sale. Add your e-mail to receive the DISCOUNT codes for our 9th YEAR ANNIVERSARY SALE (Only for new members) blog.techcharts.net/free-content/
Aksel Kibar, CMT tweet media
English
8
4
41
7.2K
Aksel Kibar, CMT
Aksel Kibar, CMT@TechCharts·
@EzraTrading I use 365 days average for crypto. It is a coincidence that price touched the 200-day. Earlier rejection was from the 365 days. We can't optimize this. One way or another long-term average can be used as a trend filter, not a level for trading decision making.
English
5
1
4
278
Ezra
Ezra@EzraTrading·
@TechCharts Hello Aksel, when analyzing BTC does the 200-MA still hold any significance to you? I noticed the rejection of the upper boundary of that channel is coupled with the 200. Thank you.
English
2
0
1
167
Felito Medina
Felito Medina@FGMTrading·
@TechCharts Ok, copy that. Thank you for that insight. I find myself hesitant to enter a trade when I have resistance overhead.
English
0
0
1
43
Aksel Kibar, CMT
Aksel Kibar, CMT@TechCharts·
@FGMTrading There is a good distance till that resistance. I wouldn't change my game plan for the ascending triangle. Possibly add or initiate new position with rectangle breakout.
English
1
0
2
218
Aksel Kibar, CMT
Aksel Kibar, CMT@TechCharts·
We have captured the #ascendingtriangle breakout @techcharts Global Equity Markets report. Though one is not limited to one pattern as the trend develops. A larger scale rectangle is completing and it can be utilized as a signal to add to existing long positions. $PEO Interested in identifying and trading these classical chart pattern setups with us? >> blog.techcharts.net
Aksel Kibar, CMT tweet media
English
3
5
90
12.4K
Aksel Kibar, CMT
Aksel Kibar, CMT@TechCharts·
2 similar chart pattern setups and breakouts. Different exchanges, sectors and geographies... Chart patterns are timeless and repetitive. What is your favorite classical chart pattern setup?
Aksel Kibar, CMT tweet mediaAksel Kibar, CMT tweet media
English
7
10
182
17.8K
Felito Medina
Felito Medina@FGMTrading·
Shouldn’t need to force lines, it should be obvious and clean. #trading
Felito Medina tweet media
English
0
0
1
21
Felito Medina
Felito Medina@FGMTrading·
Potential Dow Theory at play. We know confirmation level is shown. What’s negation level? #trading
Felito Medina tweet media
English
1
0
0
20
Felito Medina
Felito Medina@FGMTrading·
We use the weekends to look for long term setups on the weekly charts. #trading
English
0
0
1
35
Felito Medina
Felito Medina@FGMTrading·
If you lack discipline, you will most likely fail at trading. #trading
English
0
0
2
24
Felito Medina
Felito Medina@FGMTrading·
There are so many different ways to trade the markets. So many different tools. Styles, approaches, the way you see it. Educate yourself, read books, invest that time. Take bits and pieces from everywhere, and create your process. #trading
English
0
0
2
28
Felito Medina
Felito Medina@FGMTrading·
Trend is extremely important. Your ability or inability to be able to identify Uptrend, Downtrend, or sideways movement, will allow you to use the correct approach to the market. That will determine how to properly deploy capital. #trading
English
0
0
2
30
Felito Medina
Felito Medina@FGMTrading·
The part of trading that isn’t talked about much is the psychological side. Markets can stay irrational longer than you can stay solvent. My mentor made sure I understood this. #trading
English
1
0
2
38
Felito Medina
Felito Medina@FGMTrading·
@TechCharts Was literally just looking at this chart thinking the same thing sir.
Felito Medina tweet media
English
0
0
3
493
Aksel Kibar, CMT
Aksel Kibar, CMT@TechCharts·
$COIN Ideally, I like to see price above the year-long average to get excited. This could be the setup that pushes the stock above the long-term average.
Aksel Kibar, CMT tweet media
English
10
10
221
18K
Aksel Kibar, CMT
Aksel Kibar, CMT@TechCharts·
Bitcoin "cult" is annoyed with the slight adjustment of the upper boundary of the channel. They claim I'm biased but they don't see their long bias. Constantly looking for confirmation of their long position. I don't think most of the "cult" will understand but here is an important point: Be it rising wedge or a channel. In the case of a rising wedge it is even more important. The breakout of the upper boundary should come with a long white candle. This is a required signal that says bulls have clearly won the battle. Example below:
Aksel Kibar, CMT tweet media
Aksel Kibar, CMT@TechCharts

$BTCUSD

English
35
33
477
76.3K
Aksel Kibar, CMT
Aksel Kibar, CMT@TechCharts·
@Felito_GM Yields in general going up. Inflationary. Commodities a good hedge. Oil still strong. Add these up.
English
1
0
3
329