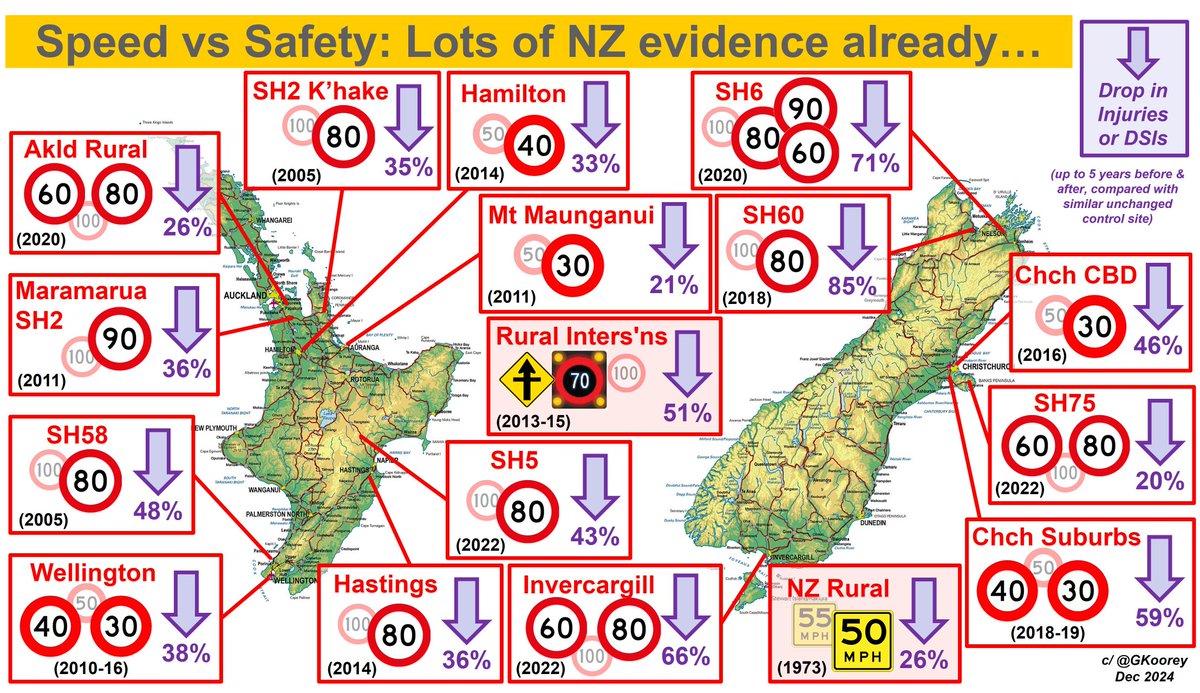
Sabitlenmiş Tweet
Glen Koorey
4.8K posts

Glen Koorey
@GKoorey
Director and Principal Transportation Engineer/Planner at ViaStrada. Specialist in road safety and sustainable transport. Also handy with cricket and Lego...
Christchurch Katılım Şubat 2012
102 Takip Edilen599 Takipçiler

@TheObserva2902 @AynRandy666 Interesting spin - the enforcement is mostly for drug/alcohol driving offences, which I think most people would agree should be "punished". Lower speed limits just induce people to slow down a bit (enforcement or not), which in turn reduces casualty numbers - basic physics
English

@GKoorey @AynRandy666 So it's good to see people punished you reckon. Now we are cutting to the real reasons you people want to lower limits. It's to exert power and control and punish people.
English

@ZooNealand @AynRandy666 Due to increased enforcement, plus all the lower speed roads/streets still out there around NZ - you're welcome...
English

@RobertAtatuPen @AynRandy666 Largely due to increased enforcement, which is good to see. But also because several roads & streets across the country still have lower speed limits (unlike Auckland that caved in and reversed most of them)
English

@AynRandy666 Here you go another article that supports your statement. Oooops actually no it doesn't

English

@TheObserva2902 @AynRandy666 Some of that drop in road deaths is due to increased enforcement, which is great to see. But many many streets & roads in NZ still also have lower speed limits from the past couple of years (Auckland being the notable exception sadly), which also reduced casualty numbers
English

@AynRandy666 The road toll has dropped significantly since the speed limits went up.
I believe the kid was hit by a cyclist. They need to get cyclists off busy roads. For safety.
English

@TerryVercoe @Jamesnotabot @GreaterAKL The info in the Word doc summarises all of the data points in the chart (which was created using PowerPoint BTW)
English

@GKoorey @Jamesnotabot @GreaterAKL Yes I got the chart, but where is it from so I can validate the data, because new highways, barrier and safety changes during those time periods may have had an impact.
English

@TerryVercoe @Jamesnotabot @GreaterAKL Well they are MS SharePoint links - perhaps I'll see if I can provide Google Drive links instead
English

@GKoorey @Jamesnotabot @GreaterAKL It is trying to force me to use one drive for some reason and the app then wants access "before" it will load

English

@TerryVercoe @Jamesnotabot @GreaterAKL Hmm, I'm not seeing an issue with the first link; it hasn't expired and no idea why it would want access to your phone files. As for the graphic, you can try to download and save the image provided or you can get the original JPG at tinyurl.com/LowerSpdChart
English

@TerryVercoe @Jamesnotabot @GreaterAKL That's a bit weird, that link should just take you a view-only version of a Word doc summarising the stats - I guess I can see if the SharePoint link has expired...
English

@GKoorey @Jamesnotabot @GreaterAKL Please post your original chart reference as that last link requested access to my phones local files
English

@LertzAdam @GreaterAKL Agreed, lots of different things can contribute to why crashes happen. But then the speed at the time of the crash significantly determines the resulting consequences...

English

@GKoorey @GreaterAKL Likewise drug/ alcohol impairment and excessive speeds should be excluded from speed limit stats. The posted speed limit has no impact on those causes.
English

@LertzAdam @GreaterAKL That's why we tend to wait a bit until there are enough crash numbers to try to identify any patterns - certainly I'll be monitoring things over the next few years...
English

@GKoorey @GreaterAKL Agree logic is that lower speed lower deaths and serious injuries. My issue is the inaccuracies of statistics/data used to measure. Eg in my area 3deaths in NZTA stats - 1 a suicide & two by a stationery vehicle. Not speed related but in the stats.
English

@TerryVercoe @Jamesnotabot @GreaterAKL Hmm, you're basing your evidence on a pseudo road safety expert, who is comparing 2021 numbers (featuring several periods of lockdowns) with 2022 (when traffic volumes went back up)? Here's my actual data: tinyurl.com/LowerSpds
English

@GKoorey @Jamesnotabot @GreaterAKL Or you couldmlook at the data of actual roads not cherry picked comparisons to give you the desired outcome. scoop.co.nz/stories/AK2301…
English

@AndyStig @GreaterAKL best to use statistics that don't link to any data - i guess you support that sort of statistic
English

@verminlionel @randomtwootera1 @GreaterAKL It's not about whether speed *causes* a crash - lots of factors often contribute. It's about the CONSEQUENCES of the resulting crash, depending on the speed at the time - that's basic physics

English

@randomtwootera1 @GreaterAKL Put the link up which shows speed caused the accidents...thought not.
English

@TerryVercoe @Jamesnotabot @GreaterAKL Nope, the comparisons were made against similar road sections that didn't have their speed limits changed over the same time period - so traffic volume changes (whether during COVID or whenever) had the same effect on both of them

English

@Jamesnotabot @GreaterAKL James, these are the same people whom included the no traffic covid periods to claim lower speed limits saved lives, truth has no place on the road to "NetZero ideologies. Remeber potholes they took 180 million out of road maintenence budgets for advertising netzero during Labour
English

@LertzAdam @GreaterAKL Well, there have also been other fatalities on other roads recently increased - sure, early days, but let's remind ourselves again what happened when the speeds were previously lowered...

English

@GreaterAKL And you know already thst speed was the cause of all three.....? Not inattention, human mistake, tiredness, impairment....?? If it was excessive so you think a posted speed limit sign would make any difference....?? So many factors that could have been in play....
English

@chris_otautahi @tomforccc Funnily enough, City Council are currently investigating the safety effects of these stone Chch. Good example is Lincoln/Barrington intsn - from one of the worst crash records beforehand to no crashes since it was raised
English

@tomforccc Surely @GKoorey could have a few words to say on these kinds of things
English

@PostQuake @chrisluxonmp At least half of that cost is for reconstructing/improving road and utility infrastructure at the same time - you're welcome... And the calculated benefit:cost of the completed cycle network was at least 8:1 - show me the expressways that even produce a 2:1 B/C ratio...
English

@Mike1104376788 @_ConnorSharp @GreaterAKL Sure, that's why most recent ones would need more time to get more robust findings - didn't stop them from all reducing though... A pity that the Akld urban ones now have to go back up. And the earlier ones have plenty of data to demonstrate their effectiveness.
English

@GKoorey @_ConnorSharp @GreaterAKL “Similar unchanged control sites”🤔
How long have the lower speed areas been operative🤔 2 years?
Difficult to get Statistically sound info I would say.
Still, keep torturing the data until it confesses.
English

The last governments reduced speed limits randomly like a patchwork quilt throughout the region. They were clunky and annoying and It’s doubtful that they reduced any accidents.
At a deeper level they were of course an “attack on the car” by ideologs who say they are concerned about safety and the environment, but really they hate capitalism and want the revolution.
Just saying
English


