John CAD
3.4K posts
John CAD
@GetAlongGoAlong
I started a new account to get rid of all the unproductive X noise. If I decided to follow you, congrats, it means you’re not full of shit
Katılım Ekim 2023
146 Takip Edilen136 Takipçiler
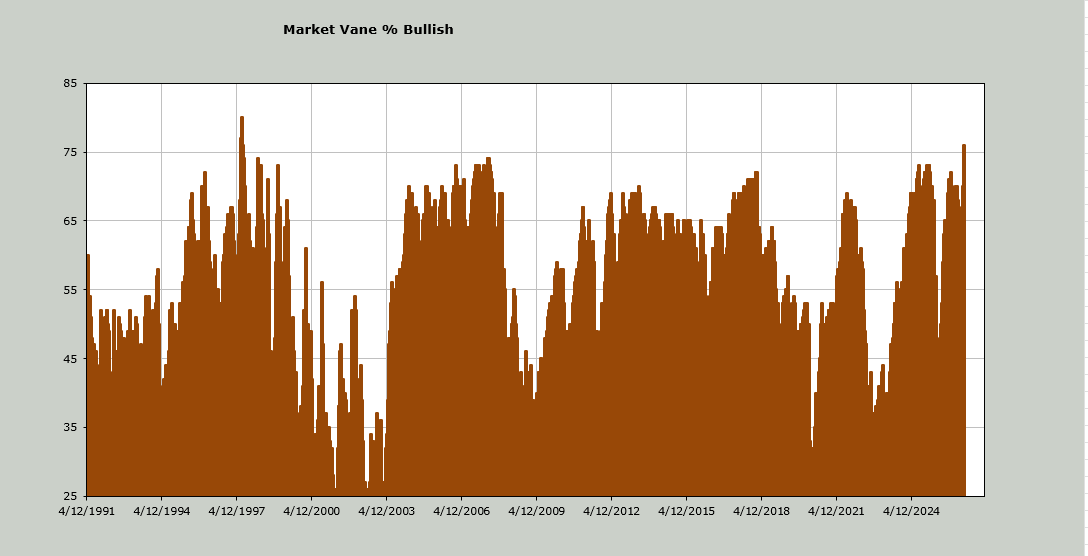
One sign of a bubble is when the market is making it so easy that everyone is making money:
Dear Trader, 2026 has been a very difficult year. The standings after three months appear on financial-competitions.com. Only 16% of our entrants are currently reporting profits. We accept late entries. If you have not already entered and wish to do so, the link to the signup page is financial-competitions.com/sign-up-2. We track your performance from the close on the day you enter. Here’s hoping for an improvement in what has so far been a dismal 2026. Best regards, Norm Zadeh, Ph.D.
English

If you are a parent who frequently hosts your kids and their teammates or friends and order pizza
And you live near a Costco, why don't you belong just to buy the $10 pizzas?
English

Market Vane Bullish Percentage is 76. Highest since June 1997.
English
@paxtrader777 God grant me the wisdom to know the difference 🙏
English

“We can serve our weakness, or we can serve our purpose”
-St Mother Cabrini.
English
John CAD retweetledi

Right now is the hardest market in history for real estate professionals.
U.S. home sales in 2025 hit just 4.06 million transactions. Preceded by just 4 million in 2024 — the lowest since 1995.
The lock-in effect has everyone paralyzed. Homeowners won’t give up their 3% mortgages. Buyers can’t make the math work at today’s prices and rates.
Owners are delisting at historic highs. Pending deals are canceling at historic highs.
Lowest sales in 30 years. Highest prices ever. Historic cancellations.
If you’re an agent, flipper, wholesaler, lender, or title agent — you’ve been living this nightmare since 2023.
And if you’re still here, still closing deals?
That’s not luck. That’s proof you’re one of the best in the business.
English
@FoundAMoron When you are that short, things go right over your head
English

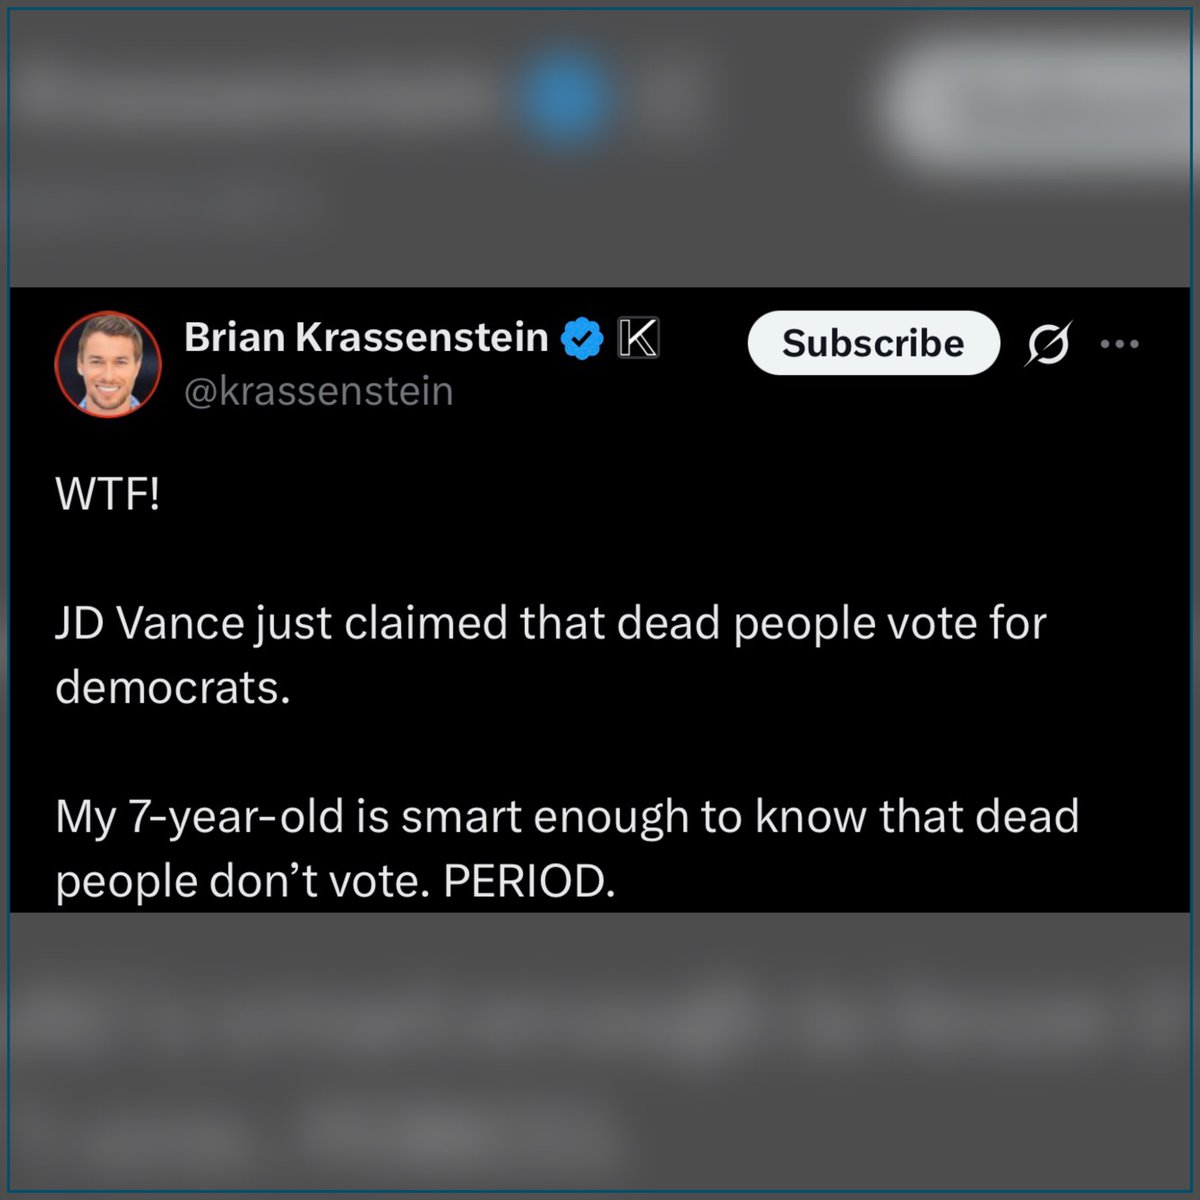
That’s right, Brian. Dead people don’t vote… Democrats vote for them instead 🤣
English
@iV_trader China gonna buy 200 Boeing jets, 1T in nvidia gpus, 500,000 teslas, 80M iPhones every day until the election
English


@faststocknewss I don’t think that’s what he meant but sure, look at the stock market
English

Trump on Xi referring to the US as "perhaps being a declining nation":
"When President Xi very elegantly referred to the United States as perhaps being a declining nation, he was referring to the tremendous damage we suffered during the four years of Sleepy Joe Biden."
Trump claims the US has since seen an "incredible rise" with "all-time high stock markets and 401K's," "military decimation of Iran," and "a record 18 trillion dollars being invested into the United States by others."
"Two years ago, we were, in fact, a Nation in decline. On that, I fully agree with President Xi! But now, the United States is the hottest Nation anywhere in the world."

English

Jay Powell’s last day as Chair is tomorrow, wrapping up 8 years of leading the Federal Reserve. His legacy: a champion for Fed independence, saving the world economy from a deep depression during the COVID shutdown, and fighting 41-year high inflation without wrecking the economy or jobs, achieving the rare soft landing.
English
John CAD retweetledi

There is no "we" in data center. This is Big Tech profits, surveillance dystopias, and Agenda 2030. They need the data centers to finish the job they started in 2020. Remember when Big Tech funded rioters while locking you down and mandating vaccines? There will be no escape.
English

@JP_Money_95630 I was predicting $400 a share by close...might've been way low
English


2 carat diamond engagement ring prices
Natural, Tiffany's - $70,000
Natural, regular retail - $14,000
Lab, downtown LA store - $1,200
English


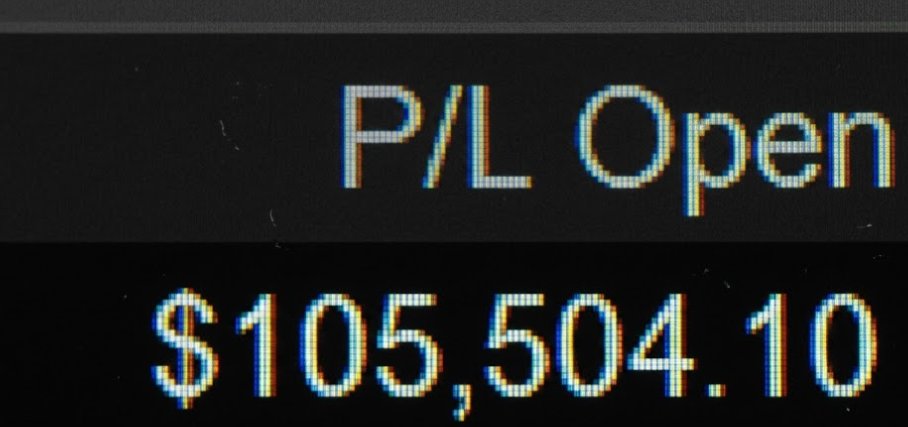
Everyone starts somewhere. First time seeing a 6 fig open gain. Not mine yet until I close out open positions. Hope this doesn't top the market lol. Surreal feeling.
$NBIS $RKLB $BE $LITE $NVDA $GLW $AMKR $HUT $SNDK $MU
frenchiestocks@frenchiestocks
Monthly PnL for July 2021: (-$2,672) Down 3% overall, great lessons to be learned this month in some of the choppiest action I've experienced. Not looking to get cute next month & make it all back on one trade. Just looking to follow my process, and trade well. Cheers HAGW🐢🍻
English

@DowdEdward Can't companies just buy SPX 0DTE to help with margins?
English

This is key to understanding what is coming. Companies can’t pass on costs to consumers. Margins get squeezed. When margins go lower companies cut costs…layoffs are part of those reductions. Demand destruction already in motion lifts off.
Kalani o Māui@MauiBoyMacro
A chart shared with me by @sirralphie2k yesterday, then a post by @yieldsearcher and another chart by @axbkol got me doing a deeper dive on this subject. The attached chart is helpful for understanding how inflation is moving through the supply chain and the volatility of producer vs. consumer prices during energy or commodity shocks. Producer prices are rising faster than consumer prices (typically a sign of margin pressure on businesses). When the line is deeply negative, businesses are often getting squeezed because input costs rise faster than they can pass them on to consumers. Producer prices (upstream) usually lead consumer prices, so big negative moves like we’re seeing now can precede CPI cooling. Yes, I know that seems counterintuitive to what almost everyone is saying right now. Additionally, these moves are often lagging the actual economic stress, driven by the same forces causing recessions (commodity swings and demand destruction).
English
@ozzy_livin Appreciate your views... The only people who always get it right are the people who always post after the fact
English