Sabitlenmiş Tweet

I don’t predict markets.
I map where risk shifts.
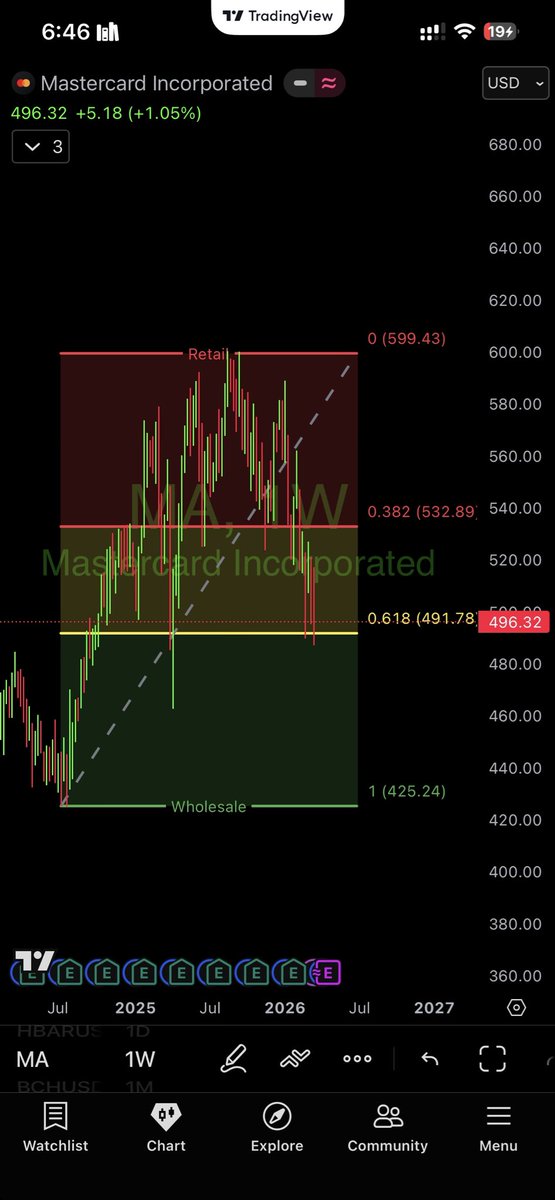
Wholesale → Equilibrium → Retail.
Above / Below. No hype.
Charts only.
Education, not signals.
Follow if you trade structure, not narratives.
English
@ImmaculateTony.Eth 🦉
15.2K posts

@ImmaculateTony
💹Innovative Investor $BTC $XMR “There is nothing accidental about what I want in life”