Dmitriy
13.9K posts

@InfraDmitriy
Take what is ours 🇺🇲🇷🇺 100% American 100% Russian


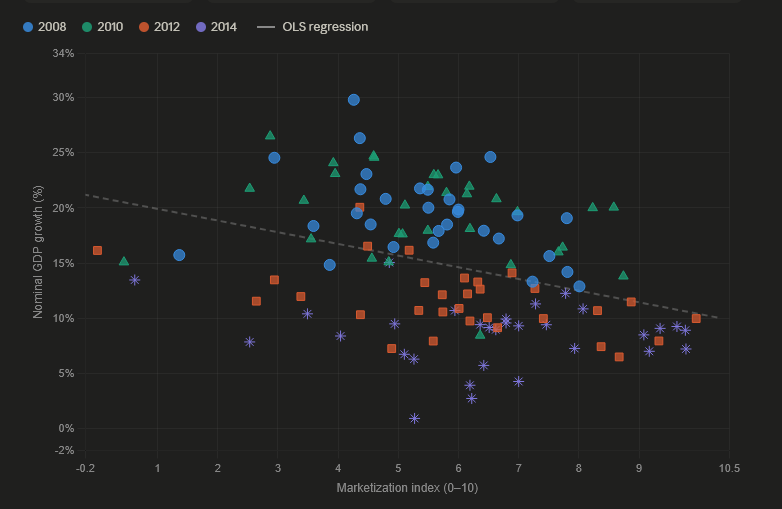
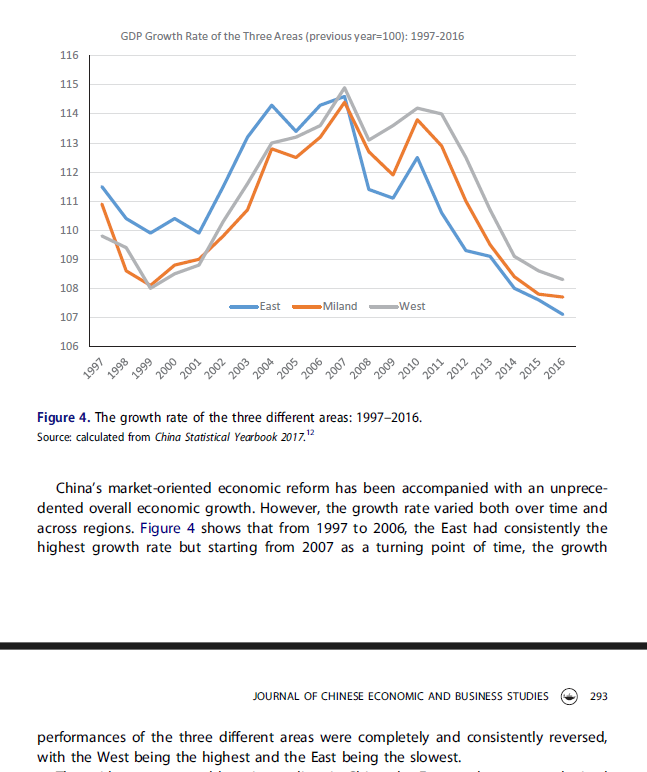
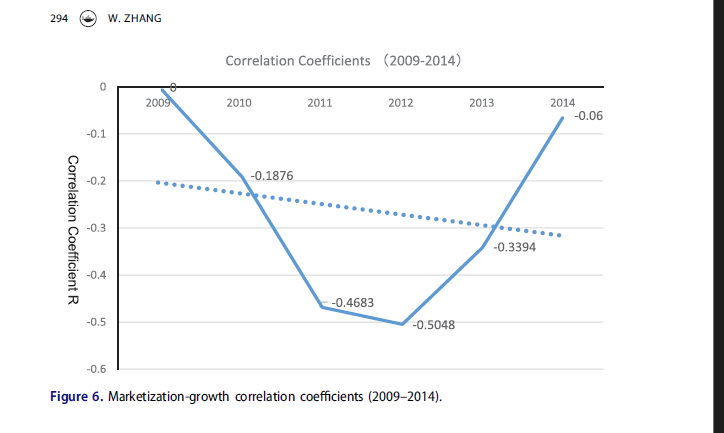
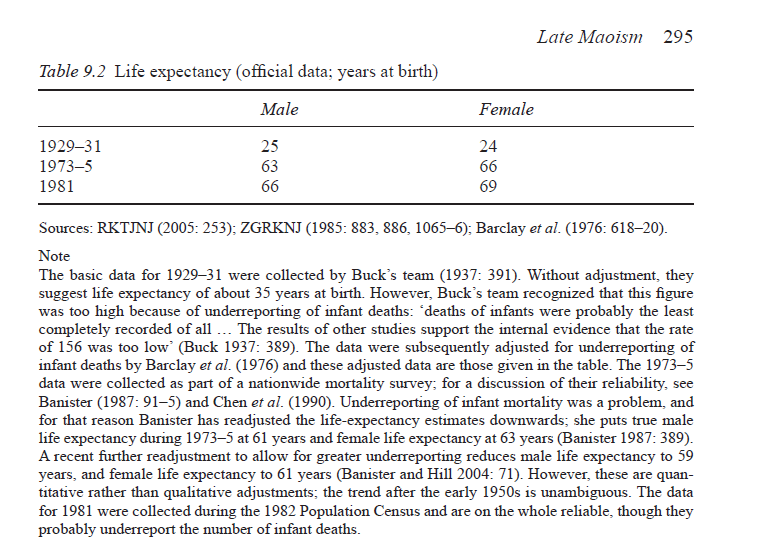
The answer to this is actually really simple, because the graph(s) itself is flawed. Why exactly are we measuring marketization score from 1997-2014 vs GDP growth over 1978-2016? This means that the outcome begins accumulating in 1978, but the supposed cause it not even measured until 1997 (and CANNOT be, since the marketization index did not exist before 1997 and was zero for every province in 1978). A province like Zhejiang or Guangdong did most of its growing during this 'gap' period (between 1978-1997), and therefore, by 1997, it was already rich, industrialized, wired into Hong Kong, etc, which is why it is scoring high on this marketization index. The marketization index is merely a consequence of the earlier growth. Anyway, this graph is largely based on Zhang's "The China Model is Factually False". In this paper, Zhang himself says that the marketization score is the "accumulated achievement of economic reform in the first two decades" - i.e., it is an accumulated outcome of what came before. As such, using an accumulated outcome to 'predict' the process which accumulated it is circular. I have attached this study for public use in the replies. But let us look further in this paper. After 2007, the relationship is completely inverted. We see that the LESS marketized Western provinces grew the FASTEST, and that the MOST marketized Eastern provinces grew the slowest. Why? If we instead plotted the marketization against the recent growth rate, the rate of change over 2007-2016, which is what tells you which model is winning TODAY, the line would tilt the other way. Further: why are we not hinting at the presence of a confounding variable? If we look at the graph attached, we see provinces such as Tibet, Qinghai, Xinjiang, etc, which are remote, high-altitude and sparsely populated areas which are far from any ports at all. But at the top-right of the graph, we see the opposite: places such as Jiangsu, Guangdong, those that are coastal and metropolitan, right next to Hong Kong and Taiwan, and which were the destinations for the overwhelming majority of the foreign investment which entered China. The eastern region absorbed about 90% of the foreign investment, while the entire west received about three. Why is it not that Guangdong has better quality of life metrics than Tibet because Guangdong is literally seated right next to the South China Sea, while Tibet has an average elevation of 10,000 feet and about 1,000 miles away from the ocean, but because it adheres to 'capitalism' more than Tibet does? Is the reason why Massachusetts has a higher quality of life over Iowa because Massachusetts adheres to more capitalism, or because Massachusetts is seated on the Atlantic Coast and has more trading opportunities, whereas Iowa is a situated in the middle of nowhere? Anyway, on life expectancy: What actually PRODUCES longer lives? The answer is, of course, clean water and sanitation, vaccinations, hospitals and doctors, infant health care, education, nutrition, and the like. And in China, these are overwhelmingly delivered by the PUBLIC sector and funded by the fiscal capacity of the Central government. A coastal province lives longer because it can fund better things for the populace And, as we can see from below, the largest gains in Chinese life expectancy happened much before marketization. See this table below. In 1929, the life expectancy for the average Chinese citizen was about 24.5 years. By 1973, it was about 64.5 years. By 1981, it was about 67.5 years. Therefore, a lot of the foundational growth in life expectancy was due to the CENTRALLY-PLANNED, MAOIST economy. Source: Bramall, C. (2008). Chinese Economic Development (1st ed.). Routledge. doi.org/10.4324/978020… I can't believe I have to say this, but when the government is actually used to serve the interests of the people instead of fighting wars for Epstein and entrapping people in debt, the people's life expectancy goes up. Wow! Again, these two graphs show that richer and more developed Chinese provinces have higher cumulative growth and longer lifespans than poorer, more remote, and more interior ones. This is simply unsurprising and pathetic. This is true for literally every country on Earth, including the U.S.



@benbackupbackup >The government’s role in the average private firm is irrelevant. LOL! No it's not. "The government is less involved, but their involvement in ownership of nominally private companies is irrelevant" Do you realize how retarded you are or are you too stupid?


The answer to this is actually really simple, because the graph(s) itself is flawed. Why exactly are we measuring marketization score from 1997-2014 vs GDP growth over 1978-2016? This means that the outcome begins accumulating in 1978, but the supposed cause it not even measured until 1997 (and CANNOT be, since the marketization index did not exist before 1997 and was zero for every province in 1978). A province like Zhejiang or Guangdong did most of its growing during this 'gap' period (between 1978-1997), and therefore, by 1997, it was already rich, industrialized, wired into Hong Kong, etc, which is why it is scoring high on this marketization index. The marketization index is merely a consequence of the earlier growth. Anyway, this graph is largely based on Zhang's "The China Model is Factually False". In this paper, Zhang himself says that the marketization score is the "accumulated achievement of economic reform in the first two decades" - i.e., it is an accumulated outcome of what came before. As such, using an accumulated outcome to 'predict' the process which accumulated it is circular. I have attached this study for public use in the replies. But let us look further in this paper. After 2007, the relationship is completely inverted. We see that the LESS marketized Western provinces grew the FASTEST, and that the MOST marketized Eastern provinces grew the slowest. Why? If we instead plotted the marketization against the recent growth rate, the rate of change over 2007-2016, which is what tells you which model is winning TODAY, the line would tilt the other way. Further: why are we not hinting at the presence of a confounding variable? If we look at the graph attached, we see provinces such as Tibet, Qinghai, Xinjiang, etc, which are remote, high-altitude and sparsely populated areas which are far from any ports at all. But at the top-right of the graph, we see the opposite: places such as Jiangsu, Guangdong, those that are coastal and metropolitan, right next to Hong Kong and Taiwan, and which were the destinations for the overwhelming majority of the foreign investment which entered China. The eastern region absorbed about 90% of the foreign investment, while the entire west received about three. Why is it not that Guangdong has better quality of life metrics than Tibet because Guangdong is literally seated right next to the South China Sea, while Tibet has an average elevation of 10,000 feet and about 1,000 miles away from the ocean, but because it adheres to 'capitalism' more than Tibet does? Is the reason why Massachusetts has a higher quality of life over Iowa because Massachusetts adheres to more capitalism, or because Massachusetts is seated on the Atlantic Coast and has more trading opportunities, whereas Iowa is a situated in the middle of nowhere? Anyway, on life expectancy: What actually PRODUCES longer lives? The answer is, of course, clean water and sanitation, vaccinations, hospitals and doctors, infant health care, education, nutrition, and the like. And in China, these are overwhelmingly delivered by the PUBLIC sector and funded by the fiscal capacity of the Central government. A coastal province lives longer because it can fund better things for the populace And, as we can see from below, the largest gains in Chinese life expectancy happened much before marketization. See this table below. In 1929, the life expectancy for the average Chinese citizen was about 24.5 years. By 1973, it was about 64.5 years. By 1981, it was about 67.5 years. Therefore, a lot of the foundational growth in life expectancy was due to the CENTRALLY-PLANNED, MAOIST economy. Source: Bramall, C. (2008). Chinese Economic Development (1st ed.). Routledge. doi.org/10.4324/978020… I can't believe I have to say this, but when the government is actually used to serve the interests of the people instead of fighting wars for Epstein and entrapping people in debt, the people's life expectancy goes up. Wow! Again, these two graphs show that richer and more developed Chinese provinces have higher cumulative growth and longer lifespans than poorer, more remote, and more interior ones. This is simply unsurprising and pathetic. This is true for literally every country on Earth, including the U.S.

If “socialism works in China,” how come the more capitalist a Chinese province is the better it performs by every metric?


If “socialism works in China,” how come the more capitalist a Chinese province is the better it performs by every metric?


Taxation is theft. Full stop.