Ash retweetledi

$QCOM - CHINA COMMERCE MINISTER MET WITH QUALCOMM CEO - STATEMENT
English
Ash
14.5K posts

@JBling5
Business Intelligence, Stocks/Options Trader. Disclaimer: My tweets are not recommendations to buy or sell any securities


🚨 Update: @mistralai npm packages are now confirmed compromised as part of the ongoing Mini Shai Hulud attack. Affected versions: @mistralai/mistralai 2.2.2, 2.2.3, 2.2.4@mistralai/mistralai-azure 1.7.1, 1.7.2, 1.7.3@mistralai/mistralai-gcp 1.7.1, 1.7.2, 1.7.3If you use the Mistral SDK in any CI pipeline, treat your environment as compromised. Rotate npm tokens, GitHub PATs, and cloud credentials immediately.


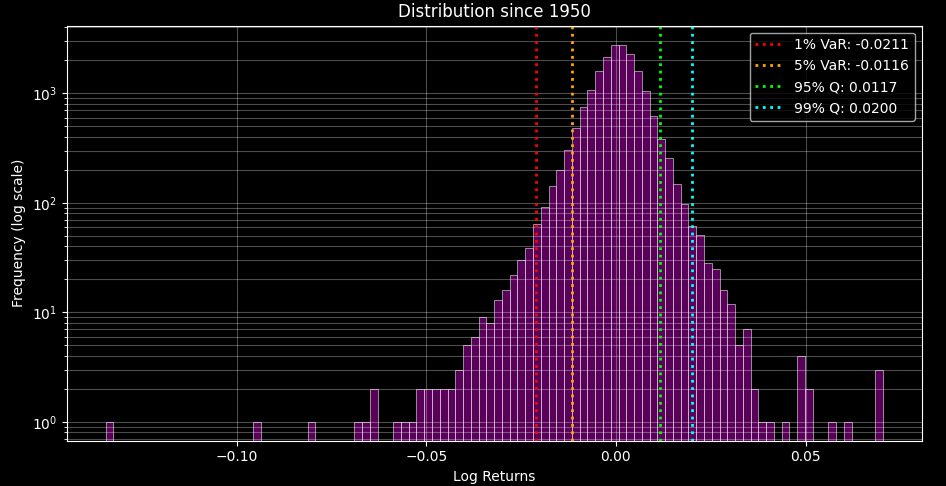
Stop trying to predict tops you'll burn yourself... When the market was below 6400, I called the bottom. I marked a certain pivot that tells us whether there will be another downside retest or not. I personally expected one, but I also said that if that level is solidly broken, the $SPX will go above 7k. Then two weeks ago, when the market was at 7086, I indicated that 7200-7300 would come before any kind of pullback. Not a trend change, but a pullback. I did this in a free post. Yes, there are many gaps below the price level; it is unstable, right-tailish, and very overvalued. But since April, this market hasn't been about valuation—nor even since 2016 for that matter. Rather, it is headline-driven. That is why they are lying that the war is over, to moderate sentiment and squeeze out downside long vol trades, reducing short-term tail risk, because a pullback might come next week that builds structure. But the inflow remains high. The distribution is bimodal, with a huge right-tail. This is key☝️ However, the economy is in an inflationary spiral. The Iranian war is not over, cyber warfare and local ops are still ongoing; they just dialed back the news coverage so it doesn't disturb risk sentiment. But even if it were over, it wouldn't solve the stagflationary shock it triggered, the effects of which haven't even hit the economy yet. Ships are bypassing Africa, shipping times are very long, insurance premiums are sky-high, there is a lack of proper real-time information, etc.—the market is not pricing these in. By autumn, in Q4 (as I have been writing for months), this will drive up energy prices, the biggest victim of which will be the overvalued AI/tech sector. In addition, core inflation is stuck around 4%, ISM prices are sky-high, and the passing of tariffs/costs onto consumers has drastically accelerated. Since inflation is rising but the central bank is not raising interest rates, real interest rates have collapsed—which practically means 'passive monetary easing.' The bond market is too complacent and is not pricing in the danger. If the Fed doesn't act now, it will later be forced into panicked, harsh (even 200 basis point) tightening. Under Warsh, the Fed might fall behind the curve if it underestimates the second-round effects of strong demand and the energy market shock. 🚩Market liquidity is currently provided by machine algorithms (HFT, Pod shops); true price discovery is missing. When the structural sell-off starts, or the AI narrative disappoints, liquidity will evaporate instantly. ☝️But as I usually write: not now. This is not an immediate thing; rather, it is gradually building into the economy. For now, it is not yet priced in. They are inflating the bubble as long as they can. Citadel doesn't want to sell right now either. As long as possible, they will squeeze everything they can out of this. But there will be a point when AI capex becomes obviously unsustainable, and reality catches up with fantasy. That is why this is a trader's market, not an investor's market. I don't understand this retail top-chasing mentality... one wants to short at all costs, the other is complacently BTD-ing. For a good while now, I have literally been propagating the latter, but only smartly. The market won't go up forever. Trade the structure, not your illusions. And don't try to predict, because in a rigged system, you can't.


🚨HOW TO USE THE HOLY GRAIL INDICATOR🚨


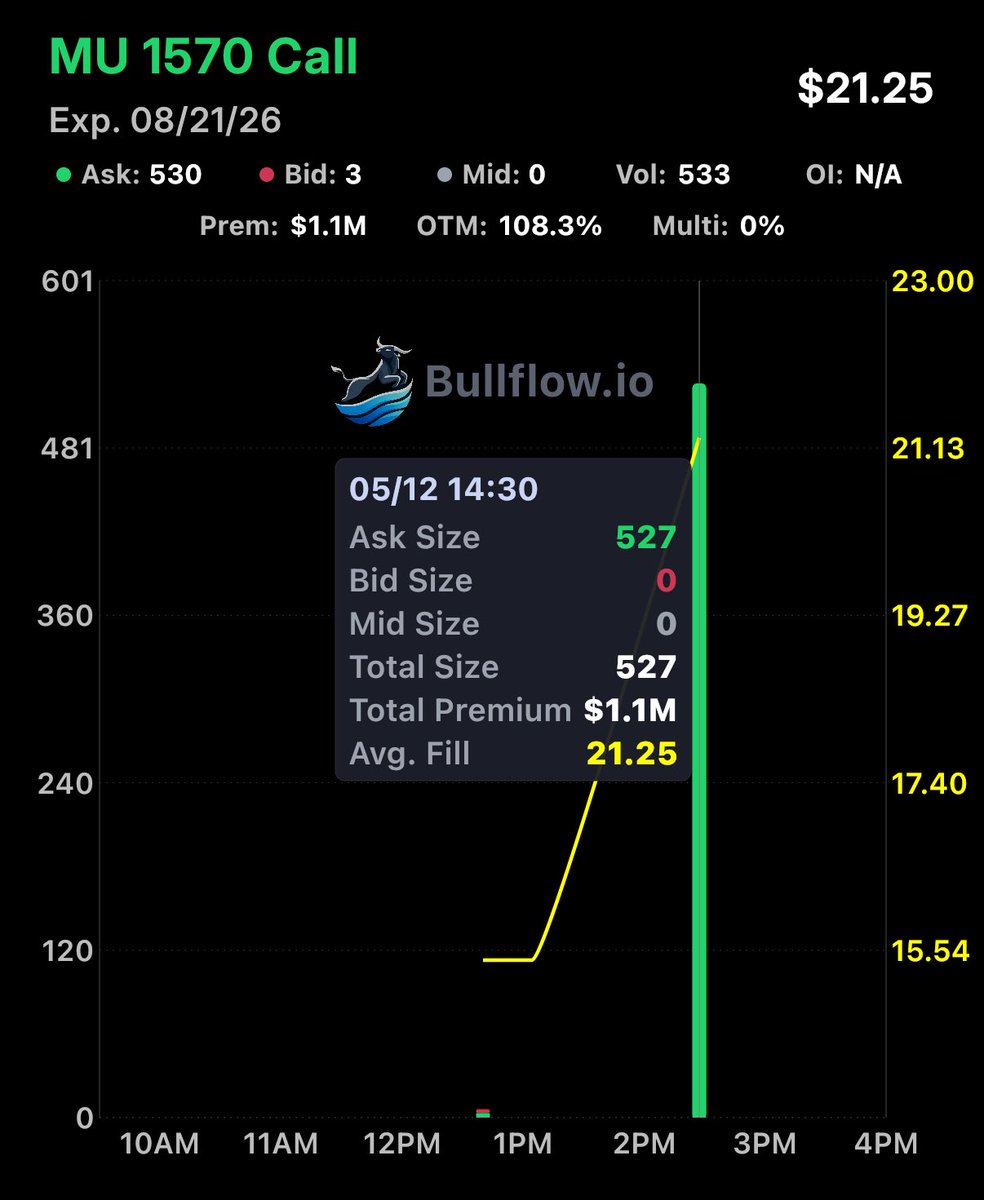
A total of $58,000,000 into these $MU calls. They loaded up all day long 🤔