

Keith Alan
9.6K posts

Keith Alan
@KAProductions
Family 1st | Content Strategies 🎬 🎙️🎥 | Fishing Fanatic 🎣 | Chart Surfer🏄♂️ | CoFounder @TeamBlacknox 💼 | CoFounder @MI_Algos🔥📈📉 No financial advice
Miami, Florida Katılım Mayıs 2009
461 Takip Edilen5.2K Takipçiler
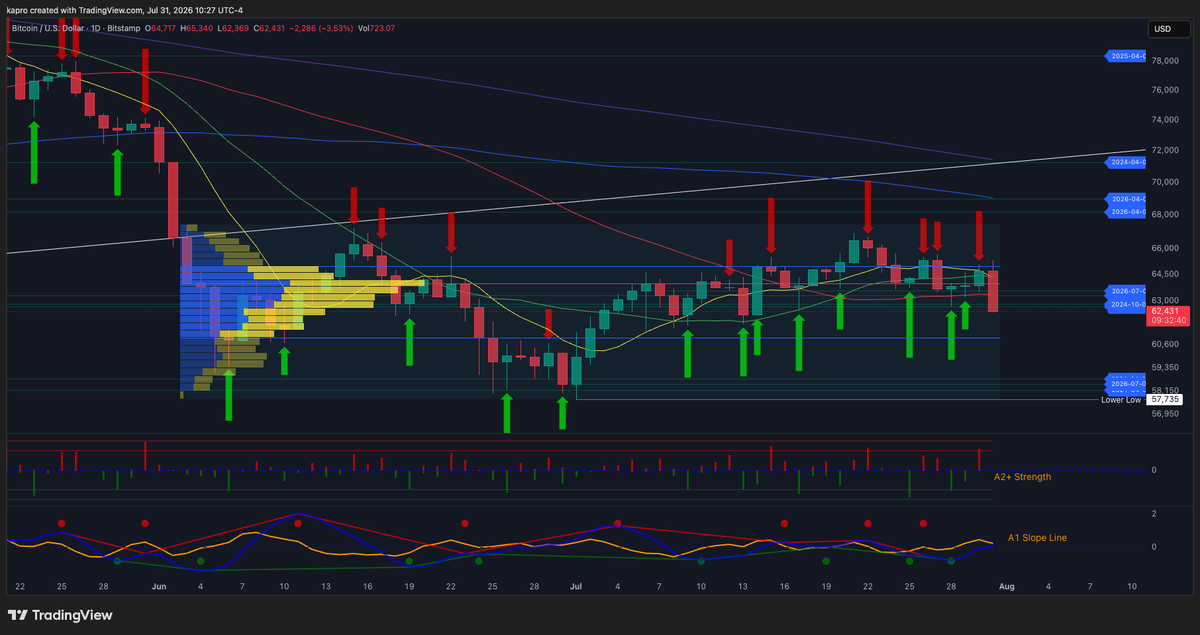
This was clearly a trap and it failed with a hard rejection from a very predictable spot at the top of the range.
I took advantage of the opportunity to add to my short.
Hope you ended up on the right side of the volatility.
Material Indicators@MI_Algos
BUSTED! Last night FireCharts revealed some big shifts in bitcoin:native liquidity dynamics designed to push price higher in the @binance order book. Every attempt failed, and the entity our Telegram community likes to call, "Spoofy the Whale", got an $81M punch in the blow hole. We talked our PREMIUM+ community members through the dynamics of the move as it played out in real time, and we played it perfectly. I'm going to take a deeper dive into what happened, and what to watch as we move through the Monthly and Weekly closes in a LIVE analysis later today. Make sure you're subscribed so you don't miss it. @MaterialIndicators" target="_blank" rel="nofollow noopener">youtube.com/@MaterialIndic…
English

Dear readers.
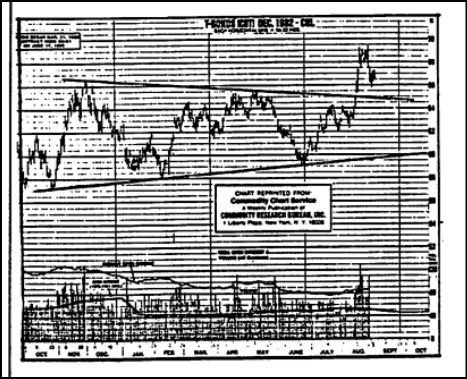
These were the only charts we had back in the early 1970 unless you wanted to make your own from graph paper. I would buy these every two to four weeks and then with a fine point black pen and ruler draw in the high to low line each day
Traders today are such wimps
English
The $BTC price action we're seeing now is very similar to what we saw in the 2022 Bear Market Breakdown. At some point, price will likely deviate from that fractal, but for now we seem to have a pretty good reference guide to follow through this stage in the cycle.
Just remember...
Fractals are good - until they're not.
See the full analysis here: x.com/KAProductions/…
Keith Alan@KAProductions
HERE'S WHAT'S DRIVING BITCOIN'S VOLATILITY x.com/i/broadcasts/1… The crypto market never ceases to amaze me. One day, a 2.5% pump to the top of the range gets the hopium dealers charged up. The next day a 2% red candle has bears posting memes indicating they have bulls in a choke hold. Meanwhile, BTC price remains within the same range it’s been chopping through for the last 7 weeks. Each tests reveals some strengths and weaknesses in each cohort’s momentum, and if you know where to look, you’ll see data that reveals a pretty clear picture of where we are in the trend. With the monthly close just days away, it’s smart to expect amplified volatility to continue, but we have a few potential catalysts on the calendar that could trigger a bigger move. In this BTC analysis we’ll take a big picture view at the structure, order book liquidity, order flow data, and broader market metrics in the MI Dashboard to gain some clarity on where we are now, and what key levels to watch to validate or invalidate which direction the next big move is likely to take the market. 📊 Trade the charts. Ignore the noise. 💬 Live chat is open. Let's dive in…
English
FED Decision Could Trigger a Huge Move
Probability of a rate hike has crept back up to 33.7% since last night.
See the full analysis here.
x.com/KAProductions/…
Keith Alan@KAProductions
HERE'S WHAT'S DRIVING BITCOIN'S VOLATILITY x.com/i/broadcasts/1… The crypto market never ceases to amaze me. One day, a 2.5% pump to the top of the range gets the hopium dealers charged up. The next day a 2% red candle has bears posting memes indicating they have bulls in a choke hold. Meanwhile, BTC price remains within the same range it’s been chopping through for the last 7 weeks. Each tests reveals some strengths and weaknesses in each cohort’s momentum, and if you know where to look, you’ll see data that reveals a pretty clear picture of where we are in the trend. With the monthly close just days away, it’s smart to expect amplified volatility to continue, but we have a few potential catalysts on the calendar that could trigger a bigger move. In this BTC analysis we’ll take a big picture view at the structure, order book liquidity, order flow data, and broader market metrics in the MI Dashboard to gain some clarity on where we are now, and what key levels to watch to validate or invalidate which direction the next big move is likely to take the market. 📊 Trade the charts. Ignore the noise. 💬 Live chat is open. Let's dive in…
English
HERE'S WHAT'S DRIVING BITCOIN'S VOLATILITY x.com/i/broadcasts/1…
The crypto market never ceases to amaze me.
One day, a 2.5% pump to the top of the range gets the hopium dealers charged up.
The next day a 2% red candle has bears posting memes indicating they have bulls in a choke hold.
Meanwhile, BTC price remains within the same range it’s been chopping through for the last 7 weeks.
Each tests reveals some strengths and weaknesses in each cohort’s momentum, and if you know where to look, you’ll see data that reveals a pretty clear picture of where we are in the trend.
With the monthly close just days away, it’s smart to expect amplified volatility to continue, but we have a few potential catalysts on the calendar that could trigger a bigger move.
In this BTC analysis we’ll take a big picture view at the structure, order book liquidity, order flow data, and broader market metrics in the MI Dashboard to gain some clarity on where we are now, and what key levels to watch to validate or invalidate which direction the next big move is likely to take the market.
📊 Trade the charts. Ignore the noise.
💬 Live chat is open.
Let's dive in…
English
Quite a few potential catalysts on the horizon for $BTC. Buckle up for some volatility.
Keith Alan@KAProductions
UPDATE Despite what the hype channels want you to believe, NOTHING has changed for $BTC or the broader crypto market over the last 4 days, however, by contrast we do have some potential catalysts for amplified volatility over the next week... Wednesday, July 29th is FED rate decision day. The market currently sees a 36% chance that the FED will raise rates 25 bps. Regardless of the outcome, the market will have a knee jerk reaction to the decision. If they do end up raising rates that would be potential catalyst for the next leg down, and for EL TACO to have a meltdown. Thursday, July 30th U.S. GDP, PCE, and Jobless Reports are likely to get a reaction from the market. Data that supports Wednesday's Fed Rate decision would fuel directional momentum Friday, July 31st is the monthly close. Historically it's common to see volatility amplified around Monthly closes, and the fact that this one marks the start of the weekend creates opportunities for more weekend f#cker!es. If bears want to challenge for a red July, we would need to see price sweep the lows around $58k. Week of August 3rd, we could see a Senate vote on the newest version of the Clarity Act. Passing this legislation is probably the most fundamentally bullish thing for crypto in the U.S. Failure to secure enough votes to pass would likely lead to another delay and more skeptics. For now, price remains below the Value Area High, and above the 21 DMA. Which one do you think breaks first?
English
UPDATE
Despite what the hype channels want you to believe, NOTHING has changed for $BTC or the broader crypto market over the last 4 days, however, by contrast we do have some potential catalysts for amplified volatility over the next week...
Wednesday, July 29th is FED rate decision day. The market currently sees a 36% chance that the FED will raise rates 25 bps. Regardless of the outcome, the market will have a knee jerk reaction to the decision. If they do end up raising rates that would be potential catalyst for the next leg down, and for EL TACO to have a meltdown.
Thursday, July 30th U.S. GDP, PCE, and Jobless Reports are likely to get a reaction from the market. Data that supports Wednesday's Fed Rate decision would fuel directional momentum
Friday, July 31st is the monthly close. Historically it's common to see volatility amplified around Monthly closes, and the fact that this one marks the start of the weekend creates opportunities for more weekend f#cker!es. If bears want to challenge for a red July, we would need to see price sweep the lows around $58k.
Week of August 3rd, we could see a Senate vote on the newest version of the Clarity Act. Passing this legislation is probably the most fundamentally bullish thing for crypto in the U.S. Failure to secure enough votes to pass would likely lead to another delay and more skeptics.
For now, price remains below the Value Area High, and above the 21 DMA. Which one do you think breaks first?

Keith Alan@KAProductions
Closing my long scalp at $67k and adding to my short position on Monday turned out to be a great move. It's hard to know exactly where and when momentum is going to fade, especially when we see such blatant manipulation in the order book, but the fact that bitcoin:native price has dropped back below the Value Range High, adds to my conviction that the bear market remains intact. That said, confluence between the 21 DMA, 50 DMA, the 200 WMA, and multiple Timescape Levels are all clustered around the POC, and adding support strength to the current range, so not sure we're going to see a big flush below $63k this week - but I do think a test of the lower boundaries of the range would be healthier than a straight rip to new highs from here. Waiting patiently for that to happen - maybe Aug/Sep.
English

DEATH CROSS ON BITCOIN. THE SCARIEST SIGNAL THAT KEEPS MARKING BOTTOMS.
Every trader sees the cross and panics. But look at 2022: it appeared after the 28.88% drop was already done. The bottom came right after.
Now it's here again at $64,737.
The measured move points to $45K.
History points the other way.
My take: this is late, not early.
English


@exodus With the recent news of crypto exchanges winding down operations, I how your business remains solid.
English


@scottmelker The market believes there is a 36% chance of a RATE HIKE. The market isn't going to like that, and neither is EL TACO.

English

FED TO ANNOUNCE INTEREST RATE DECISION JULY 29
English

Death cross just hit $BTC.
2015. 2019. 2022. Same signal every time.
You know what this means, right?
English
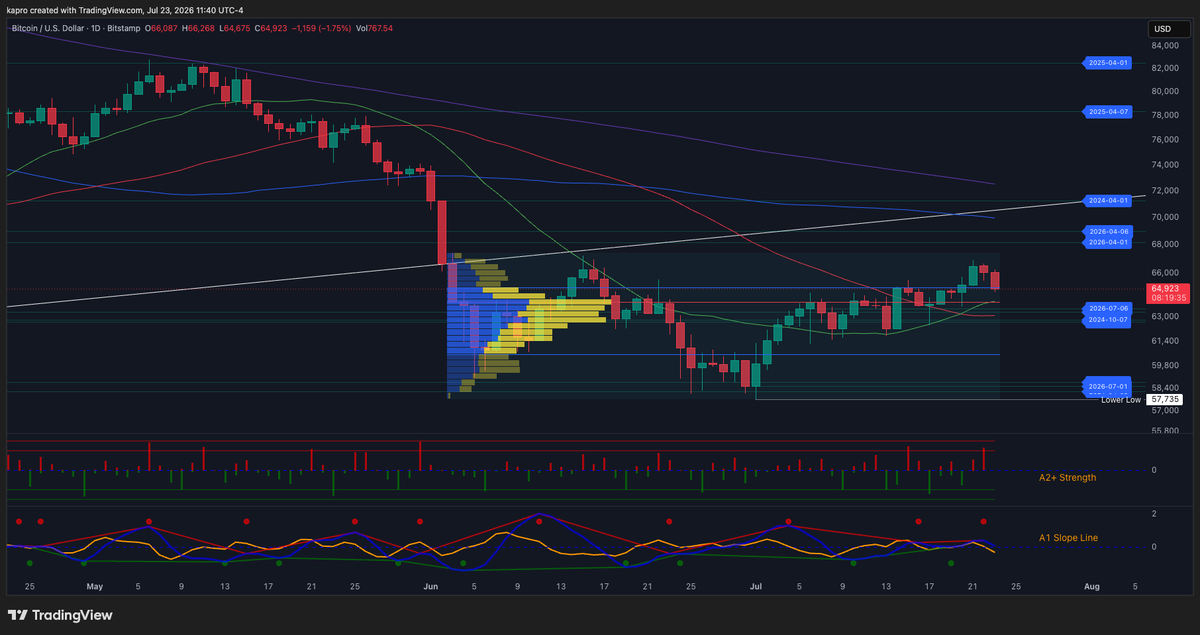
Closing my long scalp at $67k and adding to my short position on Monday turned out to be a great move.
It's hard to know exactly where and when momentum is going to fade, especially when we see such blatant manipulation in the order book, but the fact that bitcoin:native price has dropped back below the Value Range High, adds to my conviction that the bear market remains intact.
That said, confluence between the 21 DMA, 50 DMA, the 200 WMA, and multiple Timescape Levels are all clustered around the POC, and adding support strength to the current range, so not sure we're going to see a big flush below $63k this week - but I do think a test of the lower boundaries of the range would be healthier than a straight rip to new highs from here.
Waiting patiently for that to happen - maybe Aug/Sep.
English
@scottmelker Do you think the ethics clause will be a deal breaker?
English
COINBASE $COIN CEO BRIAN ARMSTRONG: "CLARITY ACT IS READY FOR A FULL SENATE FLOOR VOTE."
English
@ItsBitcoinWorld @MI_Algos Spoofy the Whale continues to herd liquidity around the order book and trap more traders.
English

Solid order flow read @KAProductions. BTC closed around $66.5k on July 21 after mid-60ks trading on the 20th, with $61k as a key recent support zone that often sees heavy liquidity. Whale dynamics and bid wall shifts are always worth watching in this range.
Sources for price context:
- WorldCoinIndex BTC historical: worldcoinindex.com/coin/bitcoin/h…
- Material Indicators / FireCharts for order book insights: materialindicators.com
What do you see for the next few days?
English
If this isn't our old friend Spoofy the Whale, then it must be a close relative.
Whoever this entity is, they appeared to get caught in their own trap yesterday. I'm speculating that they used their stack to push $BTC price up again, giving themselves the opportunity to unwind yesterday's $85M purchase in a series of smaller limit orders.
Now that they've finished with that business, they lowered the bid wall back down to $61k to punish late longs, and lure in late shorts.

English
@ItsBitcoinWorld @MI_Algos @binance @b05crypto @Mtrl_Scientist That conversation starts after we start seeing weekly closes above the 21-Week SMA. It confirms as validated somewhere around the 50-Week SMA and the Yearly Open.
English
@MI_Algos @KAProductions Solid technical breakdown on the recent $BTC move. BTC has rallied from lows near $59k to around $66k+ in July amid what analysts describe as an ongoing (though milder) bear market - price remains below key long-term MAs.
Historical data shows July often positive, with August and especially September tending weaker on average, though patterns vary. Large liquidity activity on Binance is observable via tools like FireCharts, but attributing the full rally primarily to one spoofing entity is speculative without independent confirmation.
Key question remains valid: what signals would confirm the macro bear has ended (e.g., sustained reclaim of the 21-week SMA)?
Sources for price/seasonality/bear context:
- CoinLore BTC historical data
- SeasOptima / Maketo Bitcoin monthly returns seasonality
- Recent analyses on current cycle (e.g., CoinGecko via ET News, Cantor Fitzgerald reports)
English

This $BTC rally is courtesy of one spoofy entity herding liquidity around the order book by moving, and in some cases, pulling $80M - $90M blocks of liquidity from the @binance order book.
FireCharts illustrates that this manipulative activity has been happening throughout the month of July.
Bitcoin's limited history shows us that July pumps are often followed by August/September dumps.
However you look at it, the market is testing your patience and conviction.
What is your criteria to call an end to the Bear Market?


Keith Alan@KAProductions
bitcoin:native is pumping off the confluence of a support test at the POC, a Golden Cross between the 21 and 50 DMAs, and back to back Trend Precognition signals. This is the first D candle with a chance to live above the Value Range Area High with no wicks below it since June 17th. A wick below the VAH would punish late longs and show weakness in the rally. We'll have to wait another week to see if the W candle can also print a clean breakout from the VAH - noting that the Trend Precognition A1 Slope Line is showing bullish momentum beginning to fade in higher timeframes. The good news for bulls is that there is no real resistance between here and the prior high around $67,250. Meanwhile, bears are focused on the fact that a pair of Q2 2026 Timescape Levels, the 100 DMA, the 21 WMA, and the Macro Trend Support line that was lost June 2nd are all clustered in the $68k - $70k range, and are going to be very difficult (not impossible) to break. Bear Markets don't always look like Bear Markets, especially in lower timeframes. The macro trend will be challenged if Bitcoin pushes above the 21-Week SMA. Until that happens, the Bear Market remains intact.
English