
Adam Kobeissi TK ✪
514 posts
Adam Kobeissi TK ✪
@Kob_Adam1
CEO of Investment
Mars Katılım Şubat 2012
3.3K Takip Edilen4.6K Takipçiler

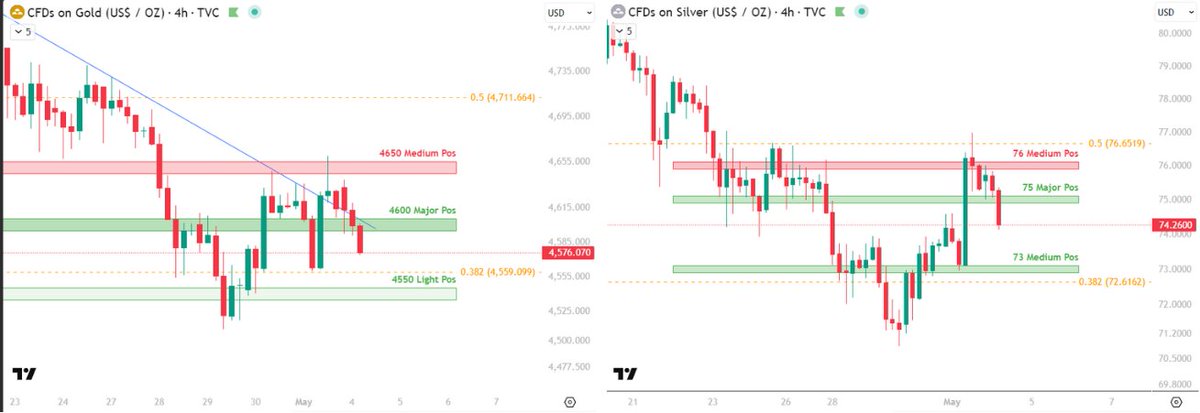
Gold and silver are slipping in thin air 👇
Gold is back below 4600
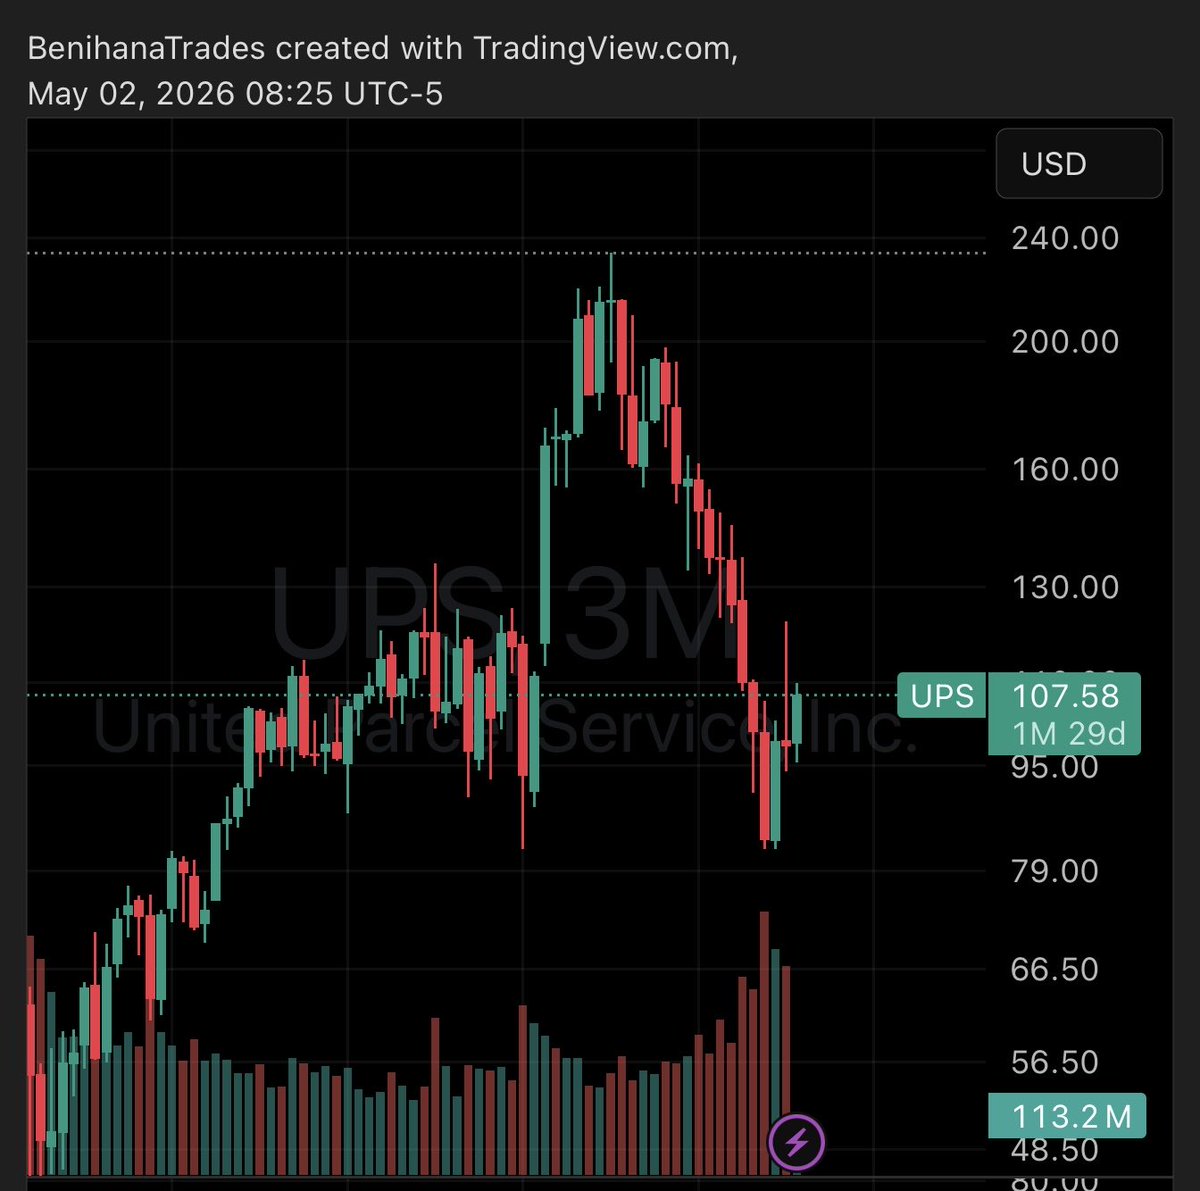
Silver is back below 75
That is not strong
But today needs caution
Liquidity is thin because China, Japan and the UK are closed
So these moves can look cleaner than they really are
Volume is low
RSI is neutral
That means this is not a panic flush
It is more a test of whether both metals can reclaim their key zones
Reclaim them, and today’s weakness looks less convincing
English


Gold and silver open into an uneasy setup👇
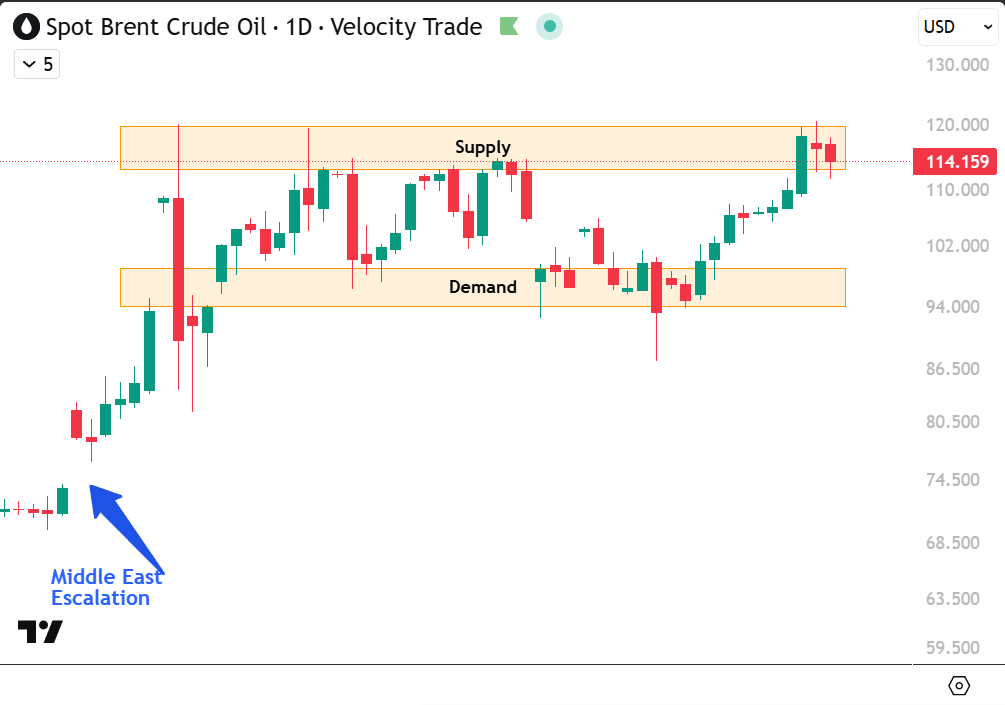
Brent ended Friday 1.74% lower
That helps the macro backdrop a little
because lower oil can ease some pressure from inflation expectations and yields
But the chart is not calm
Since the Middle East escalation
oil has been trading in a much higher range
And even after Friday’s drop
Brent is still sitting in the upper supply zone
So metals are not opening into comfort
They are opening into a market where one pressure point cooled
while the bigger geopolitical risk is still alive
That is the balance for tonight
If Brent stays under pressure after the open
gold and silver may get room to stabilize
If oil turns higher again
or Iran headlines heat up
gold probably reacts first
Silver still needs more than lower oil
It needs follow through
English

@KobeissiLetter Mate just saying its not profit taking if they're selling at all time highs
English

Hedge funds are rushing to reduce tech exposure:
Hedge funds just posted their largest 2-week reduction in US information technology exposure over the last decade, excluding the meme stock frenzy in early 2021.
This was driven by long sales outpacing short covers at a ratio of 1.5 to 1.
Nearly every subsector saw exposure cuts, led by Semiconductors and Semi Equipment via long sales.
Furthermore, hedge funds sold Magnificent 7 stocks in 4 of the last 5 trading sessions.
Hedge funds are cashing-in massive profits in tech.

English
Now MSTR's Carbon Structure has flipped from gray to gold, indicating even more bullish strength. Any retest of $150-165 is a chance to add this stock.
Next resistance will be the control line at $230, which is aligned with the 0.382 fibonacci level
English
$MSTR triggered its first 2 bullish blue stars back in January, and people thought I was crazy. Then a 3rd triggered in early April and it rocketed up, reclaiming the 200 WMA.
English
Adam Kobeissi TK ✪ retweetledi

Adam Kobeissi TK ✪ retweetledi

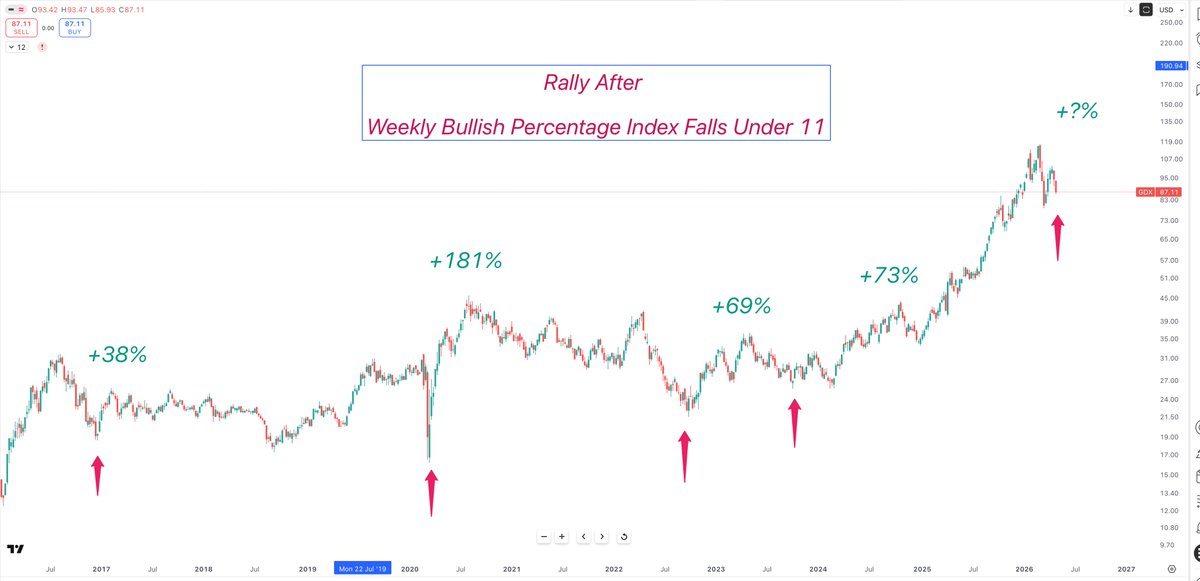
GDX - WEEKLY
Gold Miners just posted another sub 12 in the weekly Bullish Percentage Index via @StockCharts
Our chart below shows the subsequent GDX rallies
Bullish Miners
$gdx $ gdxj $gdxu $gold $silver $slv
English
Adam Kobeissi TK ✪ retweetledi

MSTR bears are worried about dividends not getting paid but refuse to acknowledge the data.
Here’s the facts.
The current dividend obligation is $1.48B annualized. Huge number if that’s all you look at. The big question, how are these dividends paid?
The common stock.
MSTR Volume Run Rate — YTD 2026
•Average daily trading volume (last month) in USD: $2.685B
•Longer-term avg. share volume: ~21.6M shares/day , with today’s stock price ~$172
•Trading days YTD 2026 (Jan 1 – May 2): ~83 trading days
•Trading days remaining in 2026: ~169
•Total trading days in 2026: ~252
YTD Dollar Volume (estimated):
Using the ~$2.685B/day avg (last 30 days as a proxy for recent pace):
$2.685B × 83 days ≈ ~$222.9B YTD
Annualized Run Rate:
$2.685B × 252 trading days ≈ ~$676.6B annualized
$676B in volume.
In other words, they must raise a whopping .21% of the entire volume on the stock throughout the year.
Take a lap bears and come back when you have an actual case to make.
English
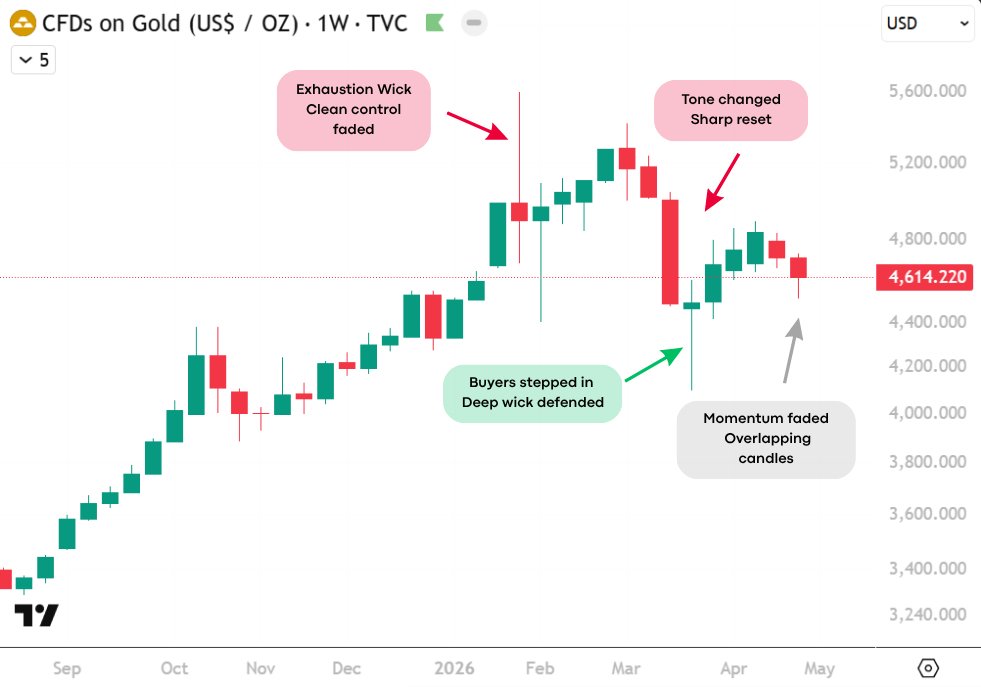
Gold has done enough to stay alive 👇
But not enough to regain control
That is the message from the weekly chart
The sharp reset did not break gold
buyers stepped in and defended the structure
That part is constructive
But the last few candles are where the caution starts
Smaller bodies
more overlap
less distance from the recovery zone
Gold is no longer falling apart
But it is also not pushing away with authority
For now
this looks less like a fresh impulse
and more like a market trying to prove the bounce is real
English
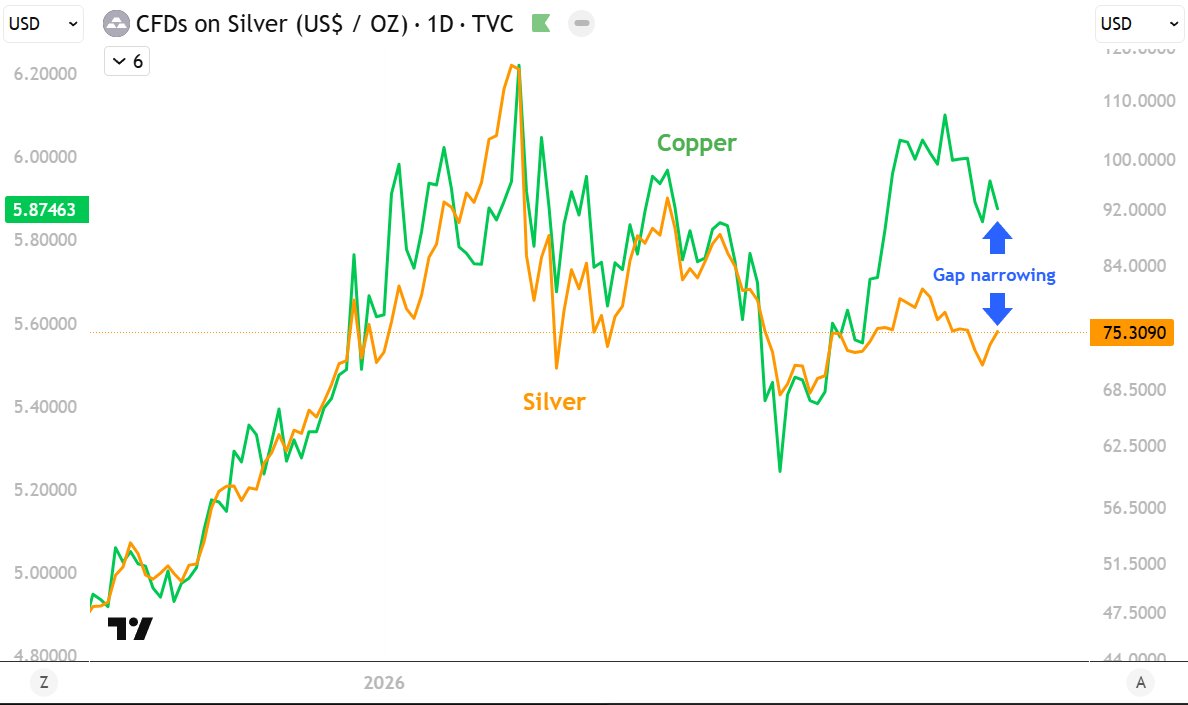
Copper and silver are not fully in sync yet 👇
For most of this chart
they moved in the same rhythm
Same rallies
same pullbacks
same industrial cycle
Then copper broke away
At the widest point
the performance gap was around 37 percentage points
Now it has narrowed to around 22
So silver has started closing the distance
The obvious question is what you can do with that information
Does this predict silver?
No
But it helps you avoid chasing the wrong move
If silver rises while copper stays strong
the rally is easier to trust
If silver rises while copper weakens
it may be more of a short term bounce
And if copper stays strong while silver keeps lagging
the catch up setup stays alive
Copper does not tell you when to buy silver
It helps you judge whether a silver move has real backing
English

@princeharry_za Haha, I hope you are right. To bounce back in under 2 months would be exceptional.
English

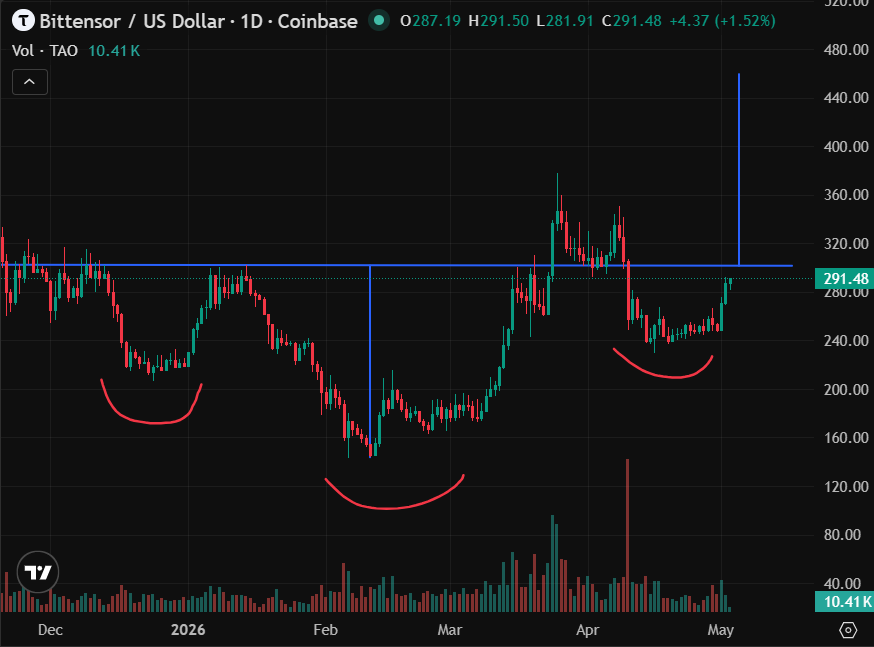
We will call this the "Sam Dare Revenge" cup, handle, head and shoulders breakout for a +50% Bittensor $TAO run in May ✍️
English
NATGAS - DAILY
NATGAS Bullish
UNG has a triple bullish RSI (5) divergence
And a close above the 10 dma
We'll be looking for a long entry this week
$natgas $ung $boil

English


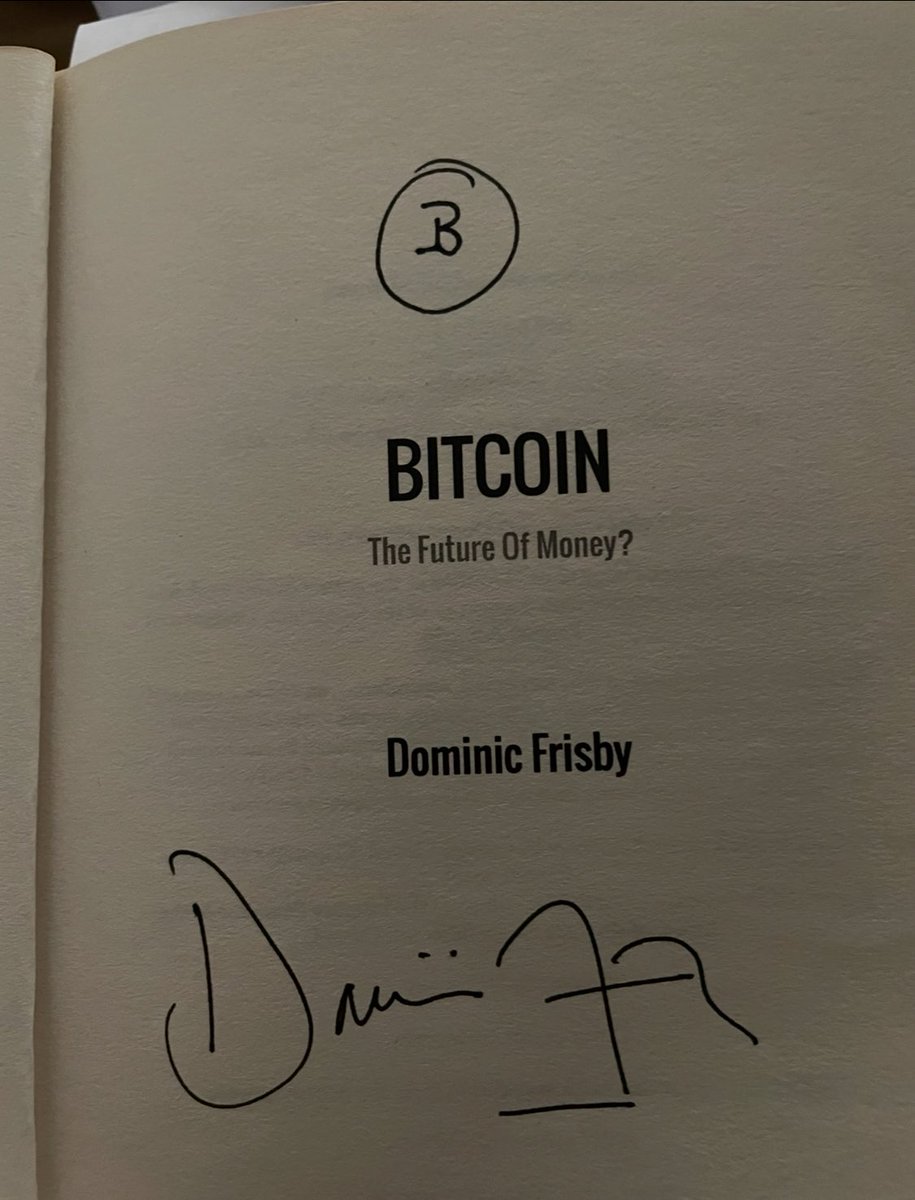
Enjoyed @DominicFrisby live at @HopeSussex last night
Even got my old paperback signed
Bought a pair of souvenir mugs too


English

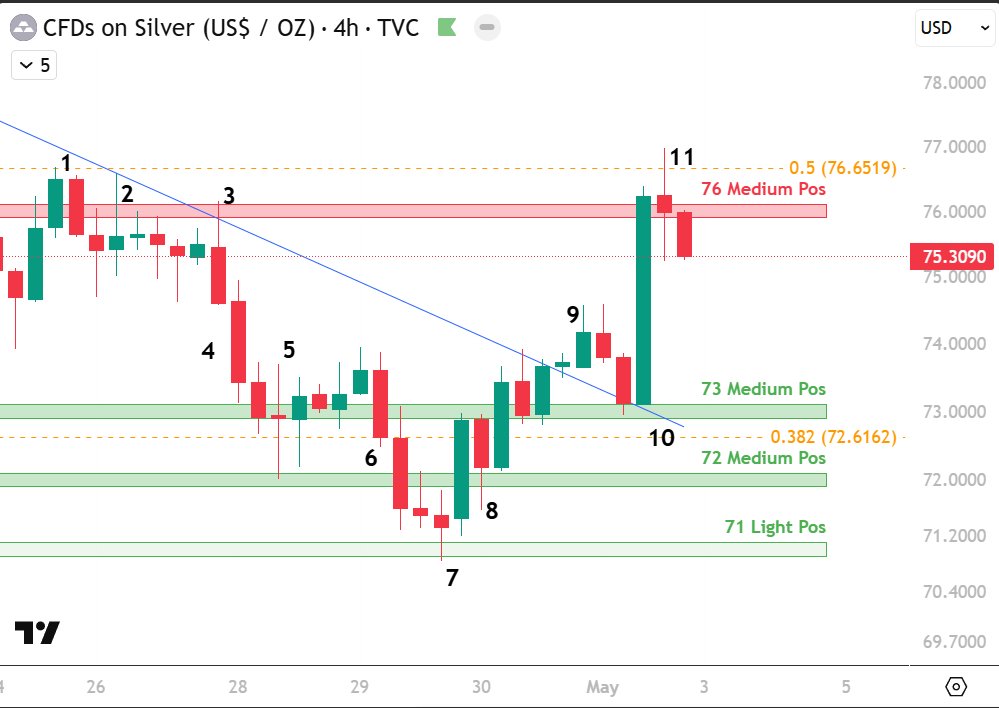
Silver: can price be predicted? 👇
Not with certainty
But structure and positioning can help you reduce risk
🔹Structure is the chart itself
trendlines, fibs, candles, bodies and wicks, RSI, volume
It shows where price reacts
and whether buyers or sellers actually defend that area
🔹Positioning shows where exposure is concentrated
open interest, options, COT, positioning zones
It shows where the market is crowded
and where price may react because of that crowding
Together, they do not predict the future
But they help you map risk
1⃣Silver touched the 0.5 fib area
But there was no clean breakout
No confirmation
More caution than confidence
Action: wait for confirmation, do not chase
2⃣Silver touched the 0.5 fib again
And also met the falling trendline
Then it dropped back below the 76 Pos zone
The upper wick showed sellers were active
Action: avoid chasing longs while sellers control that area
3⃣Silver pierced the trendline and the 76 zone
But the trendline was not perfectly clean
So the pierce alone was not enough
Price failed to hold
Another upper wick
Another seller reaction
Action: reduce risk or wait for lower levels
4⃣After that rejection, price started falling hard
The 73 zone became the next logical area to watch
Not because price had to go there
But because it was the next clear reaction zone
Action: wait for price to reach a cleaner reaction area
5⃣At this point, the candle showed wicks on both sides
Buyers and sellers were both active
Action: stay patient, no clean edge yet
6⃣Silver broke through the 73 zone
Now the question changed
Where does price react next?
That is where 72 and 71 came into view
Action: do not guess the bottom, wait for buyers to show up
7⃣Price reached the 71 zone
Buyers reacted
But the candle still showed balance
This could be an aggressive risk entry
But not a clean one yet
Action: only act here if you accept elevated risk
8⃣This was more interesting
Silver bounced back toward 73
Then pulled back again
But buyers stepped in near 72
That made 72 look like support twice
This is where the setup started to improve
Action: possible entry, but only with smaller size
9⃣Then silver broke above the falling trendline
Positive
But a breakout alone is not always enough
A retest gives better information
Action: wait for the retest instead of chasing the breakout
🔟The retest came
Price returned to the trendline area
Held around 73
And then moved higher
This was the moment where the setup finally came together
where structure, positioning and candles aligned
Action: on this chart, this was the cleanest entry point
1⃣1⃣Silver then ripped above 76 and the 0.5 fib
Strong move
But the upper wick showed buyers no longer had full control
That is where partial profit or risk reduction starts to make sense
Action: tighten risk or take partial profit
▶️The lesson
This is not prediction
It is preparation
The goal is not to know the future
The goal is to avoid chasing
wait for confirmation
and know when the setup is no longer working
This example mainly used price action and positioning zones
You can add another layer with RSI, volume, COT
Not to make the prediction perfect
But to test whether the move has confirmation behind it
That will not make trading certain
But it can make decisions cleaner and risk easier to define
English