Guillaume 🧬

4.1K posts

Guillaume 🧬 banner
Guillaume 🧬

Guillaume 🧬

@Labochain

In ₿itcoin, truth speaks louder than power https://t.co/KvE0cTMAx2 https://t.co/TSiRLnCpes

Katılım Aralık 2023
256 Takip Edilen333 Takipçiler
Caffè Satoshi
Caffè Satoshi@CaffeSatoshi·
The only Bitcoin indicator you’ll ever need. Meet the Bitcoin Cycle Indicator, my open-source PineScript for TradingView. No repaints. No lag. No paid “secret sauce.” Just the Gold/Copper ratio, smoothed into a clear signal that shows exactly when the next Bitcoin cycle begins. Spoiler: it’s beginning right now. The old 4-year halving narrative? Dead. Bitcoin has matured – ETFs, nation-state adoption, macro flows. Halvings are rounding errors now. Clinging to 2017 models is lazy. I’m a Bitcoin maxi. I don’t sell courses, Discord groups, or $997 e-books. Those guys can’t trade, so they sell dreams. Me? I’m open-sourcing the whole thing. No paywall. No email. No “premium later.” Drop it on a chart. Watch the real cycle unfold. Let’s ride. 🧡 Here’s the code 👇 //@version=5 indicator(title="Bitcoin Cycle Indicator - more info : x.com/CaffeSatoshi", overlay=false) copperClose = request.security("COMEX:HG1!", "1M", close, lookahead=barmerge.lookahead_on) goldClose = request.security("COMEX:GC1!", "1M", close, lookahead=barmerge.lookahead_on) ratio = goldClose != 0 ? copperClose / goldClose : na calcHist() => fastMA = ta.ema(ratio, 12) slowMA = ta.ema(ratio, 26) macdLine = fastMA - slowMA signal = ta.ema(macdLine, 9) macdLine - signal hist = request.security("COMEX:HG1!", "1M", calcHist(), lookahead=barmerge.lookahead_on) isNewMonth = ta.change(time("1M")) lineColor = hist >= 0 ? color.new(#2196f3, 0) : color.new(#ef5350, 0) fillPlot = plot(hist, style=plot.style_line, color=color.new(color.white, 100), linewidth=1) zeroPlot = plot(0, style=plot.style_line, color=color.new(color.white, 100), linewidth=1) fill(fillPlot, zeroPlot, color=hist >= 0 ? color.new(#2196f3, 80) : color.new(#ef5350, 80)) plot(isNewMonth ? hist : na, title="Cycle Line", style=plot.style_line, color=lineColor, linewidth=2) hline(0, "Zero", color=color.new(color.gray, 60), linestyle=hline.style_solid, linewidth=1)
Caffè Satoshi tweet media
English
8
14
112
7.5K
Bram Kanstein
Bram Kanstein@bramk·
“I don’t understand it but I hate it anyway”
Bram Kanstein tweet media
English
107
152
2.1K
37.7K
Guillaume 🧬
Guillaume 🧬@Labochain·
Il y a un truc qui s’appelle l’insolvabilité c’est pas mal
Alfred@Alfred__info

@jon_delorraine La carte d'identité des objets pour vérifier votre bilan carbone et vous empêcher d'acheter une fois le quota dépassé avec des amendes si vous possédez des objets sans fiche carbone.

Français
0
0
0
17
Romain Hedouin 🇫🇷 Unit Police
Here is the paperwork I have to fill up myself for taxes in France This is my punishment for working and investing my money Never go full socialism
English
183
160
1.8K
70.6K
Guillaume 🧬 retweetledi
Fiboswanny
Fiboswanny@FiboSwanny·
Most people never question it because the system trained them not to. They are too exhausted surviving inflation, taxes, and debt payments to notice their productive years are being quietly harvested to sustain a machine mathematically incapable of stopping itself. That is the tragedy. Not ignorance alone, but engineered distraction.
Fiboswanny tweet media
English
1
8
29
1K
James Lavish
James Lavish@jameslavish·
Can I say something?
James Lavish tweet media
English
356
713
4.6K
1.1M
Guillaume 🧬
Guillaume 🧬@Labochain·
@OVcrypto Une synchronisation avec un ou plusieurs autres actifs Intéressant, time will tell
Français
0
0
1
10
OVcrypto
OVcrypto@OVcrypto·
Hi! Je ne crois pas que c'est l'aspect cycliques des marchés qui est essentiellement débattu mais plutôt que Bitcoin soit dans un cycle non lié aux autres marchés. Si bitcoin continue de s'institutionaliser et ça semble être le cas, il se pourrait fort que ses cycles se synchronisent sur les actifs risqués traditionnels. Il y a beaucoup de literature sur le sujet des cycles de marchés, notamment la théorie de JM Hurst mais aussi les travaux de Clément Juglar, Edward R. Dewey, Jonathan Cahn etc
Français
1
0
2
39
OVcrypto
OVcrypto@OVcrypto·
Good work, good chart 🤝
Überrenditen@Uberrenditen

Der 100-Jahre-Plan für den Aktienmarkt Wenn du dir die letzten 100 Jahre anschaust, siehst du ein klares Muster: Der Markt wiederholt immer wieder die gleichen Zyklen. Seit der Großen Depression 1930 gab es drei große Abwärtsphasen und drei Aufwärtsphasen . Wir stecken gerade mitten im dritten großen Bullenmarkt. Die schlechten Zeiten (Bärenmärkte) Diese Phasen dauerten meistens etwa 9 Jahre (die Weltwirtschaftskrise von 1930 war mit 12 Jahren eine Ausnahme). Ein typisches Zeichen war, dass der Markt zweimal oben und zweimal unten „anklopfte“, bevor es wieder aufwärts ging. Oft krachte der Kurs bis zu einer bestimmten langfristigen Linie (dem 300er-Schnitt im Monatschart) und startete von dort aus neu durch. Die guten Zeiten (Bullenmärkte) Die ersten beiden großen Aufwärtsphasen dauerten jeweils 24 und 25 Jahre. Das Spannende: Sobald der Markt einmal Fahrt aufgenommen hatte, fiel er fast nie unter eine bestimmte grüne Linie (den 100er-Schnitt). Die blaue Linie (50er-Schnitt) war dabei immer die beste Chance, um günstig nachzukaufen, wenn es mal zwischendurch ruckelte. Warum steigt der Markt so extrem? Hinter jedem Bullenmarkt steckt eine neue Technologie: Früher waren es industrielle Durchbrüche. Dann kam der Internet-Boom. Heute erleben wir den E-Commerce- und Social-Media-Boom. Klar, irgendwann platzen diese Blasen immer, weil die Leute übertreiben. Aber die Technik bleibt! Das Internet ist nicht verschwunden, nur weil die Kurse im Jahr 2000 abgestürzt sind – es wurde zum Fundament für alles, was wir heute nutzen. Der KI-Boom Wir sind jetzt im zweiten Teil des aktuellen Aufschwungs, und der wird von der Künstlichen Intelligenz getrieben. Wahrscheinlich wird diese Blase um das Jahr 2034 platzen. Das wird wehtun, aber danach wird KI das feste Rückgrat unserer gesamten Wirtschaft sein. Im Grunde sind die letzten 100 Jahre eine Kette von Erfindungen, die die Kurse immer höher treiben. Die Abstürze zwischendurch sind nur dazu da, die heiße Luft rauszulassen und Platz für neues Geld und die nächste Technologie zu machen. Was bedeutet das für dich heute? Wenn dieser Zyklus so läuft wie die letzten beiden, könnte der S&P 500 bis auf 17.000 Punkte steigen. 
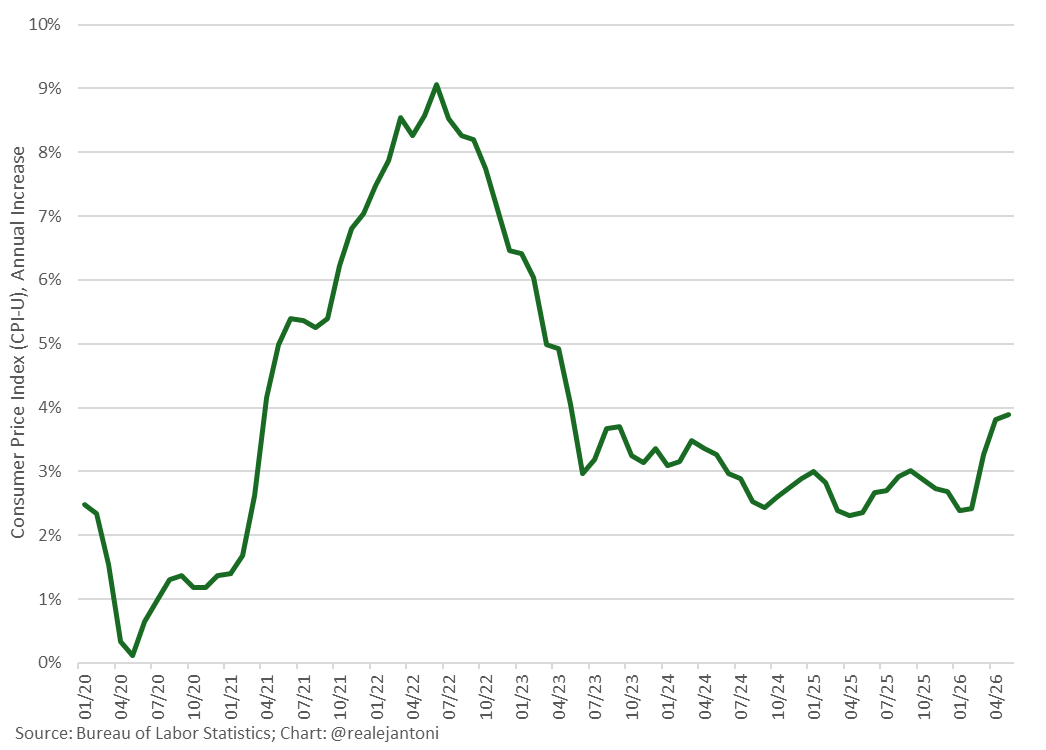
Es wird zwischendurch immer wieder Korrekturen geben. Der Zoll-Crash Anfang 2025 war so ein Moment, hat aber die wichtige blaue Linie nicht ganz berührt. Schau auf den RSI-Anzeiger. Wenn der unter 30 fällt, ist das eine Chance des Jahrzehnts. Das ist in 100 Jahren erst sechsmal passiert – und jedes Mal war es der perfekte Zeitpunkt zum Kaufen. Liken, Folgen, Speichern, Kommentieren, Teilen. Danke für den Support 🫶😊🫶

English
2
0
23
940
E.J. Antoni, Ph.D.
E.J. Antoni, Ph.D.@RealEJAntoni·
Inflation rose again in Apr, hitting 3.9% Y/Y, highest since May '23:
E.J. Antoni, Ph.D. tweet media
English
6
13
50
6.1K
Guillaume 🧬 retweetledi
René
René@schizohustler·
any faggot can get a job it takes real passion to be $neet
English
10
17
203
9.1K
Guillaume 🧬
Guillaume 🧬@Labochain·
@HodlFlorida For 2026 the real risk is deflation Then big print Then another round of high inflation
Guillaume 🧬 tweet media
English
1
0
2
19
Guillaume 🧬 retweetledi
CR1337
CR1337@CR1337·
Btw, if you have never seen the movie; it's kinda mandatory, do it.
CR1337 tweet media
English
6
14
131
6K