Mercy l Business Analyst

826 posts

Mercy l Business Analyst banner
Mercy l Business Analyst

Mercy l Business Analyst

@Mancy_Gold

Data Analyst | Excel • SQL • Power BI | Sharing data projects

Imo, Nigeria Katılım Ocak 2022
183 Takip Edilen102 Takipçiler
Sabitlenmiş Tweet
Mercy l Business Analyst
Mercy l Business Analyst@Mancy_Gold·
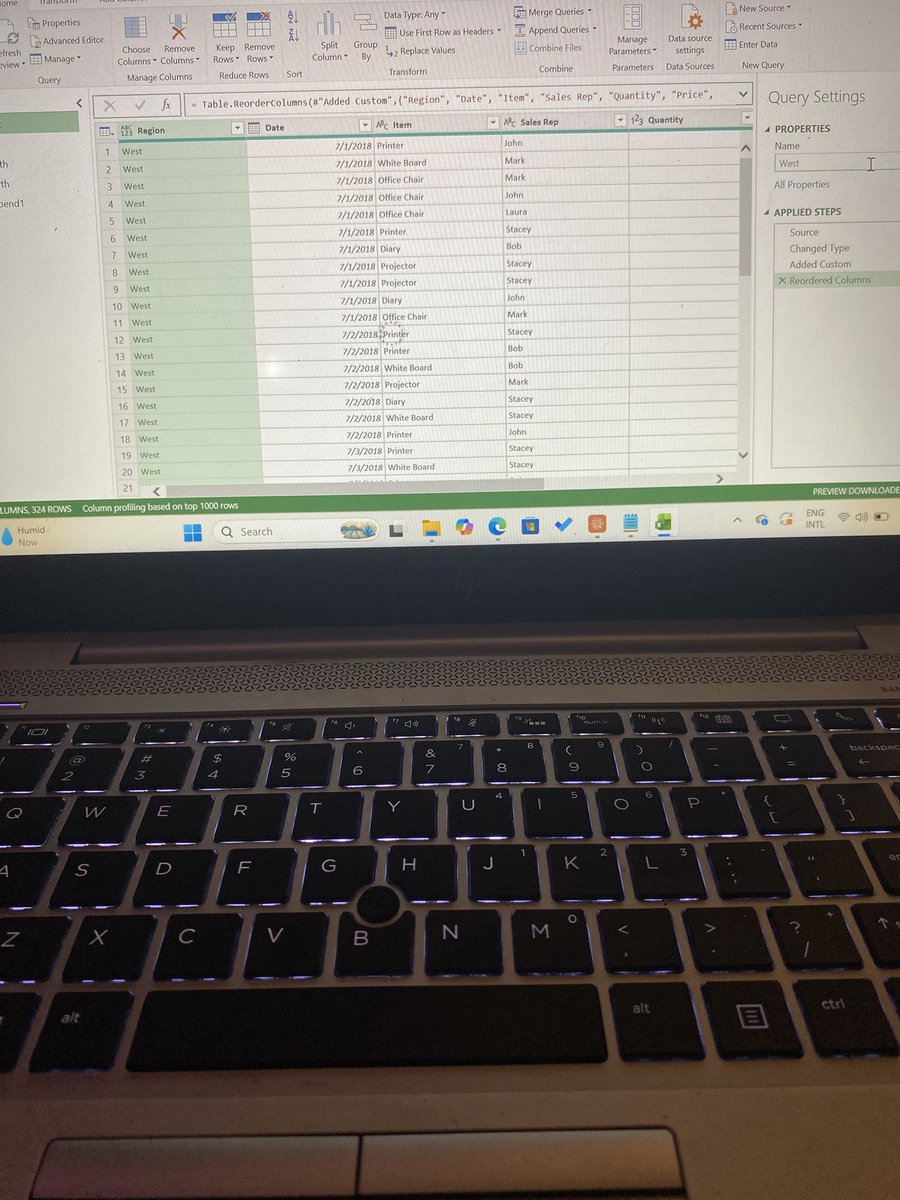
Built a Sales dashboard designed to track performance, customer behavior, and key KPIs in one clear view 📊 The goal: turning complex data into insights that support smarter, faster decisions. #datafam #dataalive #DataAnalytics
Mercy l Business Analyst tweet media
English
0
1
2
184
Annie🦋
Annie🦋@DabereNnamani·
From dashing my then-boyfriend my laptop because “I wasn’t really using it” anyway… To waking up one morning, chopping breakfast, and deciding I was going to learn tech. To borrowing my friend’s laptop just to start. To buying a 4GB laptop with my very first pay. Then 8GB. Then 16GB. To partially moving out. To building a community. To building a consultancy firm. To hosting a tech summit. To traveling to Different countries. To buying a family house. Beloved, it is a PROCESS. Every single step matters. And by God’s grace, this is just the beginning!!
English
69
54
889
23.1K
Mercy l Business Analyst
@ObohX Honestly.... I felt the same too... It felt like a lot of people were faking to be perfect...which made me to stop posting there for a long time...but after a while I decided to make a difference... I now decided to post to inspire others and show others what I can do as well.
English
1
0
1
11
Freedom | Excel Boss
What are they always doing on LinkedIn? This app is an interesting place. Every single day somebody is “happy to share” something. A new promotion. A scholarship. A certification. A startup launch. A remote job. etc You open the app and someone just completed a PhD while working a 9–5 and raising three kids. And honestly… sometimes it feels fake. A lot of people hate LinkedIn for this reason. The app can feel performative. Like everybody is trying too hard. Like people are constantly packaging their lives into announcements. But here’s what I’ve started to understand. One thing I learnt from LinkedIn is this: give yourself credit. Sing your own praise. Because behind all the noise of “I’m happy to share…” is someone giving account of what they’ve done. Don’t wait for people to praise you. Praise yourself first. Nobody knows you took that course… tell us. Nobody knows you graduated with a first class… tell us. Nobody knows you’re learning something new… tell us. Share your journey. Speak about your progress. Own your growth. What you’re doing is making people aware of what you can do, what you’ve achieved, and what you can handle. Don’t play humble about what you do. Scream it (with evidence). Because you’re scrolling saying “his dashboard is not even fine”… but your own fine dashboard where is it? Guess who gets the gig? Not you ! If you like, don’t sit up. I’d love to hear your thoughts too. What do you think LinkedIn is really doing for people?
Freedom | Excel Boss tweet media
English
9
4
37
1.1K
Tech P
Tech P@Tech_p001·
Tech will make you give up But don't give up!!!
English
24
16
91
2.4K
Thelma Etuk
Thelma Etuk@officialladi_T·
If you're learning something new right now, what's the hardest part so far ?
English
16
0
41
2.4K
Mercy l Business Analyst
Monday reminder: Being busy is not the same as being productive. One thing data analysis teaches quickly is this: patterns reveal problems early. The question is: what patterns are you ignoring? #DataAnalytics
English
0
1
1
4
Annie🦋
Annie🦋@DabereNnamani·
Instead of telling Claude, "write code." To build your portfolio website, Here is a good prompt you can give to it to help you create one: Portfolio prompt Create a modern, responsive personal portfolio website for a data analyst/data scientist. ## INPUT DATA I will provide: 1. My CV (extract name, bio, skills, experience, education, tools, and achievements from it) 2. Three Medium article links: ( depending on where you have your projects, list them and inserts the links) ## GOAL Build a clean, professional portfolio website that highlights my analytical skills, storytelling ability, and real-world project impact. The website should be optimized for recruiters, hiring managers, and collaborators. ## DESIGN STYLE - Minimalist, modern, and elegant - Use a tech/data aesthetic (subtle grids, charts, or abstract data visuals) - Color palette: dark mode or soft neutral tones with one accent color - Typography: clean sans-serif (professional and readable) - Smooth scrolling and subtle animations (fade-ins, hover effects) ## WEBSITE STRUCTURE ### 1. HERO SECTION - My name - Title (e.g., Data Analyst | Data Scientist | Business Intelligence Analyst) - Short 1–2 sentence value proposition (derived from CV) - CTA buttons: - "View Projects" - "Download CV" ### 2. ABOUT SECTION - Short professional summary (from CV) - Key strengths (data storytelling, analytics, visualization, etc.) - Tools & technologies (icons preferred: Python, SQL, Power BI, Excel, etc.) ### 3. PROJECTS SECTION (MAIN FOCUS) Create 3 project cards, each with: - Project title - Short summary (problem → approach → insight) - Key tools used - 1–2 key insights or outcomes - Button: "Read Full Case Study" (links to Medium article) Projects: (List your projects) Each project should look like a case study preview, not just a link. ### 4. EXPERIENCE / SKILLS SECTION - Extract from CV - Highlight measurable impact where possible - Include both technical and analytical skills ### 5. CV SECTION - Provide a downloadable CV button - Optionally show a short preview ### 6. CONTACT SECTION - Email - LinkedIn - Medium profile - Optional: GitHub ## FUNCTIONAL REQUIREMENTS - Fully responsive (mobile, tablet, desktop) - Fast loading - Clean navigation (sticky navbar) - Accessible (good contrast, readable text) ## OUTPUT FORMAT - Generate complete HTML, CSS, and optional JavaScript - Code should be clean, well-structured, and ready to deploy - Use semantic HTML - Include comments for easy customization ## OPTIONAL ENHANCEMENTS - Add a “Featured Insight” highlight from one project - Add subtle data visual elements (charts/graphs style design) - Add hover animations on project cards ## IMPORTANT - Do NOT use placeholder lorem ipsum - Use actual content extracted from my CV - Make the tone professional, confident, and results-oriented - Prioritize clarity and storytelling over decoration
English
15
80
344
12.7K
Thelma Etuk
Thelma Etuk@officialladi_T·
Just curious… do data analyst really make money in reality?
English
53
17
330
58.3K
Duru | Data Analytics
I’m putting together beginner-friendly Data Analytics projects you can add to your CV. Interested? Comment “PROJECTS” 👇
English
67
5
80
5.1K
Databeauty
Databeauty@Delightbeauty7·
I finished a data task in 20 minutes that they gave me 1 hour for. I send a bold cold message to a CEO for my internship after I finished my data analytics training. The company sent me a task: Row Explosion No one taught me that during training But I had practiced it on my own. Quietly. Consistently. Beyond the course outline. They gave me 1 hour. I finished in 20 minutes. Then came the message: Congratulations Lesson: Don’t wait for someone to pick you. 📍 Prepare 📍 Knock 📍 Pitch Sometimes the door is not closed, it just needs someone brave enough to push it. Take that step today. Repost to inspire someone.
Databeauty tweet mediaDatabeauty tweet media
English
12
6
25
327
Mercy l Business Analyst
Excel Tip: COUNTIF and SUMIF allow you to analyze specific parts of your data. Instead of calculating everything, you can focus on values that meet certain conditions. This is useful when working with categories or filtered insights. #DataAnalytics #Excel
English
0
0
0
1
Mercy l Business Analyst
@vheeorji22 Solid foundation in Power Query 👏 Being able to import multiple file types is where real data preparation starts.
English
0
0
0
6
vivian
vivian@vheeorji22·
Today I learnt and practice: - How to import text files into power query - How to import CSV files into power query - How to import files from the web into power query - How to import files from the current workbook into power query - I also learnt how to Append Excel tables in the same workbook
vivian tweet mediavivian tweet media
English
4
3
37
1.2K
Anjali
Anjali@anjalinirwal02·
What slows you down the MOST? -> Bad tools -> Slow system -> Distractions -> Lack of clarity
English
58
1
63
1.9K
Femi The Analyst .
Femi The Analyst .@Femiforge·
5 THINGS PEOPLE GET WRONG ABOUT DATA ANALYTICS. You probably don't need half of what you think you need to become a data analyst. ❌️You don't need to be a math genius. ✅️You need to think clearly and ask better questions. ❌️You don't need to learn every tool before applying. ✅️You need Excel, SQL, and one BI tool. Start there. ❌️You don't need to code like a software developer. ✅️You need SQL and a basic grip on Python. That covers most of what the job actually demands. ❌️You don't need to treat dashboards as the whole job. ✅️You need to understand what sits behind them — dirty data, vague briefs, and problems that arrive without a clear structure. ❌️You don't need a massive dataset to do real work. ✅️You need a sharp question. That will always matter more than the size of the data.
English
4
3
16
663
Ezekiel
Ezekiel@ezekiel_aleke·
Your 4GB RAM HP laptop watching you open Power BI with your Internet on
Ezekiel tweet media
English
26
20
199
7.3K
Thelma Etuk
Thelma Etuk@officialladi_T·
Practiced small data cleaning.... Testing your Excel basics-- which tool/feature in excel was used to transform this data?
Thelma Etuk tweet mediaThelma Etuk tweet media
English
9
0
49
2K
Mercy l Business Analyst
Mercy l Business Analyst@Mancy_Gold·
Learning Excel today. The more I practice, the more I realize: it’s not the formulas that matter—it’s the thinking behind them. What helped you understand Excel faster? #DataAnalytics #Excel
English
0
0
1
9
Mercy l Business Analyst retweetledi
Mercy l Business Analyst
Mercy l Business Analyst@Mancy_Gold·
One useful shortcut I learnt... CTRL + SHIFT + & this helps to apply borders in Excel. #Data
English
0
1
1
10