

Marcus Casey
4.8K posts
Marcus Casey
@MarcDCase
Associate Prof @ UIC | Nonresident Fellow @BrookingsEcon | @HowardU alum | Retweets are not endorsements
Chicago Katılım Mart 2011
926 Takip Edilen888 Takipçiler

My Mom passed away on May 4 after a short battle with cancer. Call your Mom today, see her if you can. And those of you who can’t, let the lasting memories and cherished times strengthen you. bradshawcarter.com/obituaries/Gio…
English

What's the one Chicagoland Restaurant that you always wish you could still go to?
Is there one you went to as a kid, and now you have your own kids, that you think they would have loved going to?
Our personal favorites just to name a few?
• KOW KOW (Pratt & Cicero)
• The Signature Room (John Hancock)
• The Parthenon (Greek Town)
• Mattson's (Over By There)
• John's Garage (IYKYK)
• Don Roth's (Spinning Salad Bowl)
• Max's Italian Beef (On Western)
There. Just listed some bangers.
Make @chicago_history proud & try to remember some forgotten favorites that don't quite get the recognition that they truly deserve.
#ChicagoHistory ☑️

English
@instrumenthull Yep. Back in the day, Roger Koenker used to call this mistake one of the key “fiascos of econometrics” that you would often see.
English

So, this is actually a common mistake! Frisch-Waugh-Lovell works by residualizing on the *right* (i.e. the x-axis), not only on the left. In this case you'd only recover the regression relationship by residualizing the HHI measure (with or without residualizing the rebellious activity measure)
I wrote a note about this a few years ago (link below)
Vincent Geloso@VincentGeloso
My graduate student Patrick Crawford introduced me to "partial residual plots" as a tool for showing relationships. Its so simple in elegance. The partial residual plot below shows the conditional relationship between newspaper competition and rebellion after controlling for everything else. On the x-axis is market concentration (HHI: higher = fewer newspapers), and on the y-axis is the residualized level of rebellious activity. Basically, the entire logic of the graph is for visualization. The regression has already controlled for other variables. What remains is the variation in rebellion intensity (depvar) attributable to the independent variable of interest. "Centered" just means both axes are normalized so that 0 corresponds to the sample mean. Positive values imply more rebellion than average (conditional on controls) (and vice-versa). Now, its not exactly a new estimation method per se. But it does allow for a nice visualization of results that I had not seen and may even allow you to play with different functional forms with the residuals. I know we should not care about "does it look cute" but I disagree with that sort of. I mean, at one point, we have to convince and convincing is really about cutting on inputs needed to (honestly) push a person from disbelief to acquiescence. That graph below is cutting down on inputs.
English
Marcus Casey retweetledi


Name a player that doesn’t get enough love, I’ll start. Mark Price.

English


Who was your favorite MLB player when you were a kid?
I’ll start.. Don Mattingly
English

🎉I'll be promoted to full professor at the University of Pennsylvania School of Social Policy & Practice, effective July 2026! Grateful for of the many people who've helped and challenged me along the way. Now off to work on #AI and its impact on the economy, society, & policy!
English
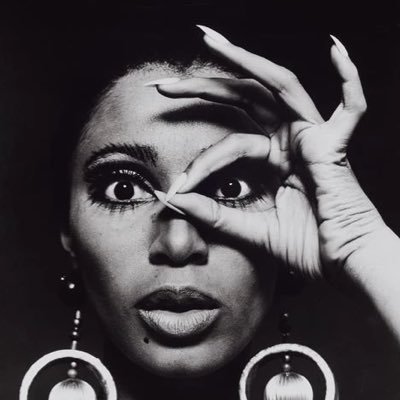
I was the kid that didn’t put condiments on their hot dogs (I know, I know haha)
Then my freshman year at Howard, I went to Ben’s Chili Bowl for the first time and that changed 😋
She and her restaurant are an institution
Ben's Chili Bowl@benschilibowl
Virginia Ali co-opened Ben's Chili Bowl at 24 years old. She drove her kids to school in the morning, worked the counter starting at 11, picked them up in the afternoon & then went back to Ben's. At 92, we are blessed that she is still here with us & greeting guests most days.
English
Marcus Casey retweetledi
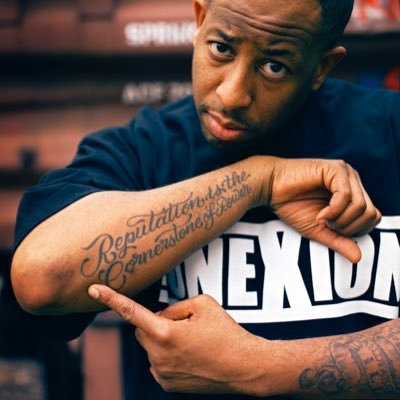
R.I.P. to one of the iLLest Engineers of all time...
Mr. BOB POWER.
Thank you for your various pointers in recording from D'angelo to ATCQ'S Low End Theory, Erykah Badu's Baduizm and so on! 🫡🙏🏾🕊️
English
@EastonMajor Lord Finesse is nice. I bump Funky Technician all the time.
English



Being from the crib you better know this as well

Jay Renee@eeneryaj
If you from Chicago & don’t know who Svengoolie is then yo ass is not from here
English
Marcus Casey retweetledi

Ghostface & Killah Priest already KILL the track before RZA steps in & bodies it again!! 🔥
& GZA still turned up to remind EVERYONE whose album it was! 🗡️
No weak verse. Wu murder at its peak!
MVP? 👇 #WuWednesday👐
English
Marcus Casey retweetledi
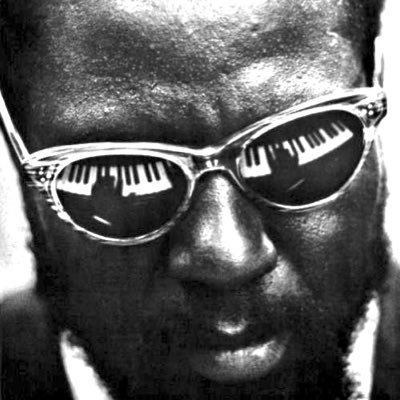
Wes Montgomery’s touch on the guitar is pure elegance
English
Marcus Casey retweetledi
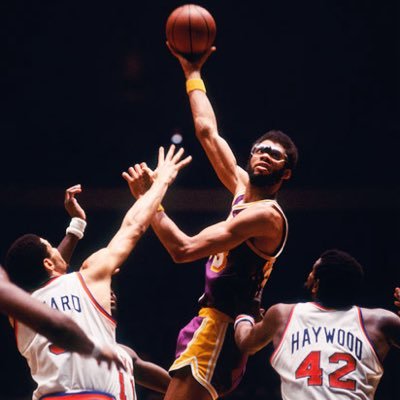
Still one of the best postseason dunks ever. Michael Jordan beats a double team then dunks on Patrick Ewing.
1991 1R Game 3
English
Marcus Casey retweetledi
Remembering the great Burt Bacharach, who passed away on this day in 2023.
English
Marcus Casey retweetledi
Before the icons, there was Jackie Wilson setting the standard.
English