
Sabitlenmiş Tweet

Mark Arbeter, CMT
6.6K posts

@MarkArbeter
Technical consultant for Argus Research. Head Technician @ S&P for 20 yrs. Shortlisted as one of best technicians in '13. Newsletter info: [email protected]
Semiconductor Bubble, as defined by 2-years of excess returns. Shaded areas are defined Semiconductor (blue line) bubbles. Horizontal line details cycle peaks after lose momentum from 2-yr excess returns which comes after $SOXX +125% -150% returns, achieved as of June! Has the cycle peaked? Won't know for sure without hindsight, but seems unlikely even with the defined 2-yr excess returns. $SMH $SPX $SPY $QQQ $NDX $MU $NVDA $AMD $MRVL $INTC $COMPQ (NDR)





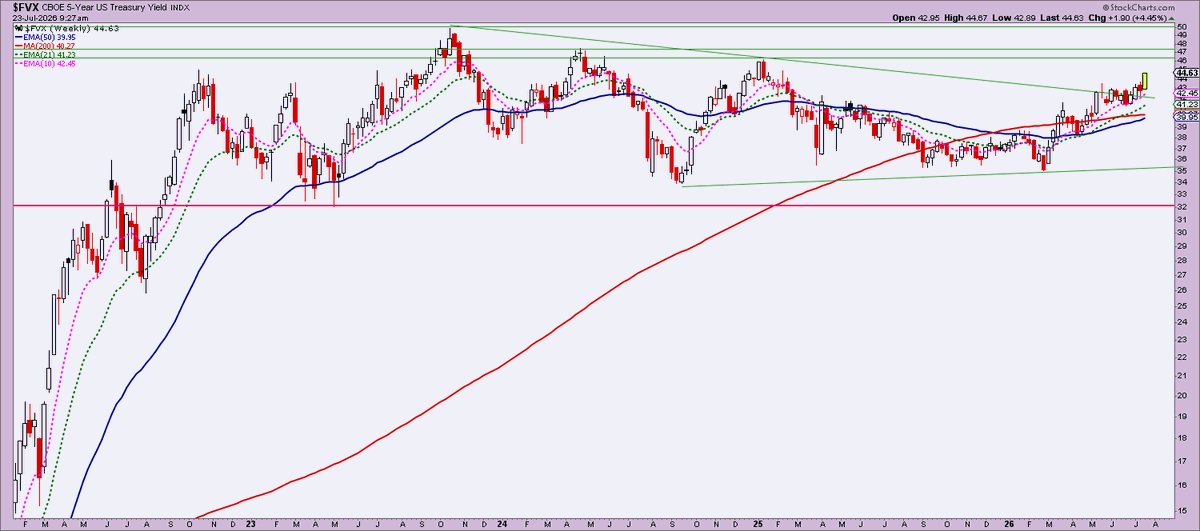
30 Year Treasury Yield > Covid timeframe, even if shorter term. This will be a headline somewhere. Enjoy.


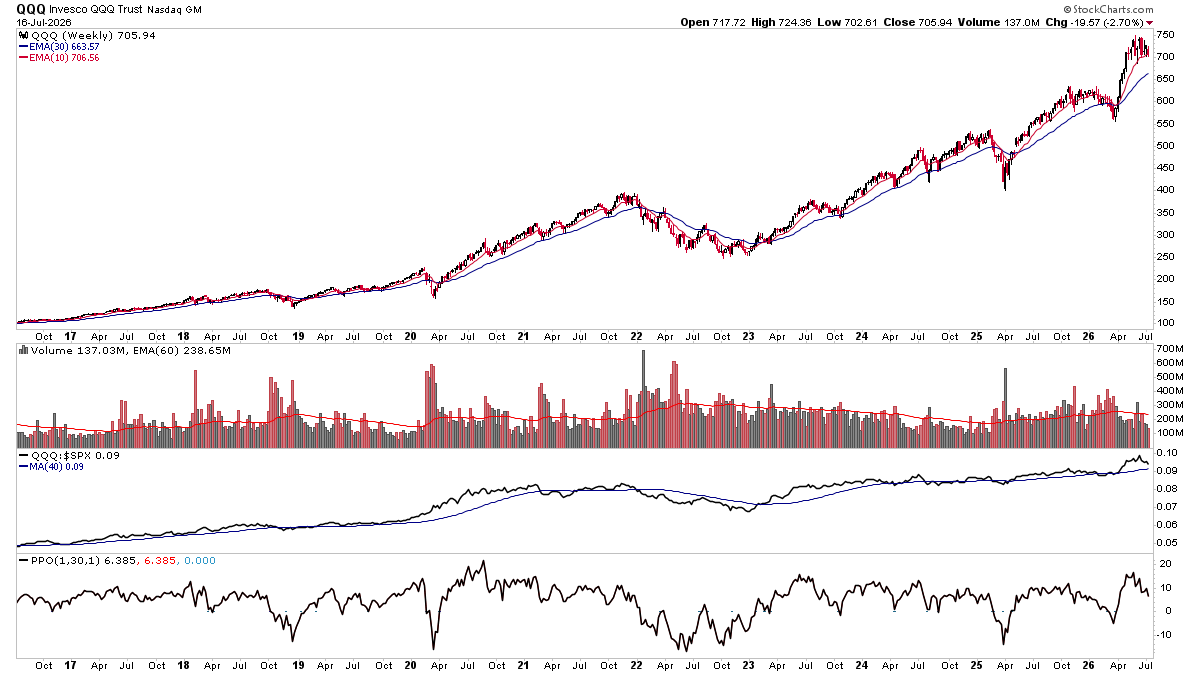
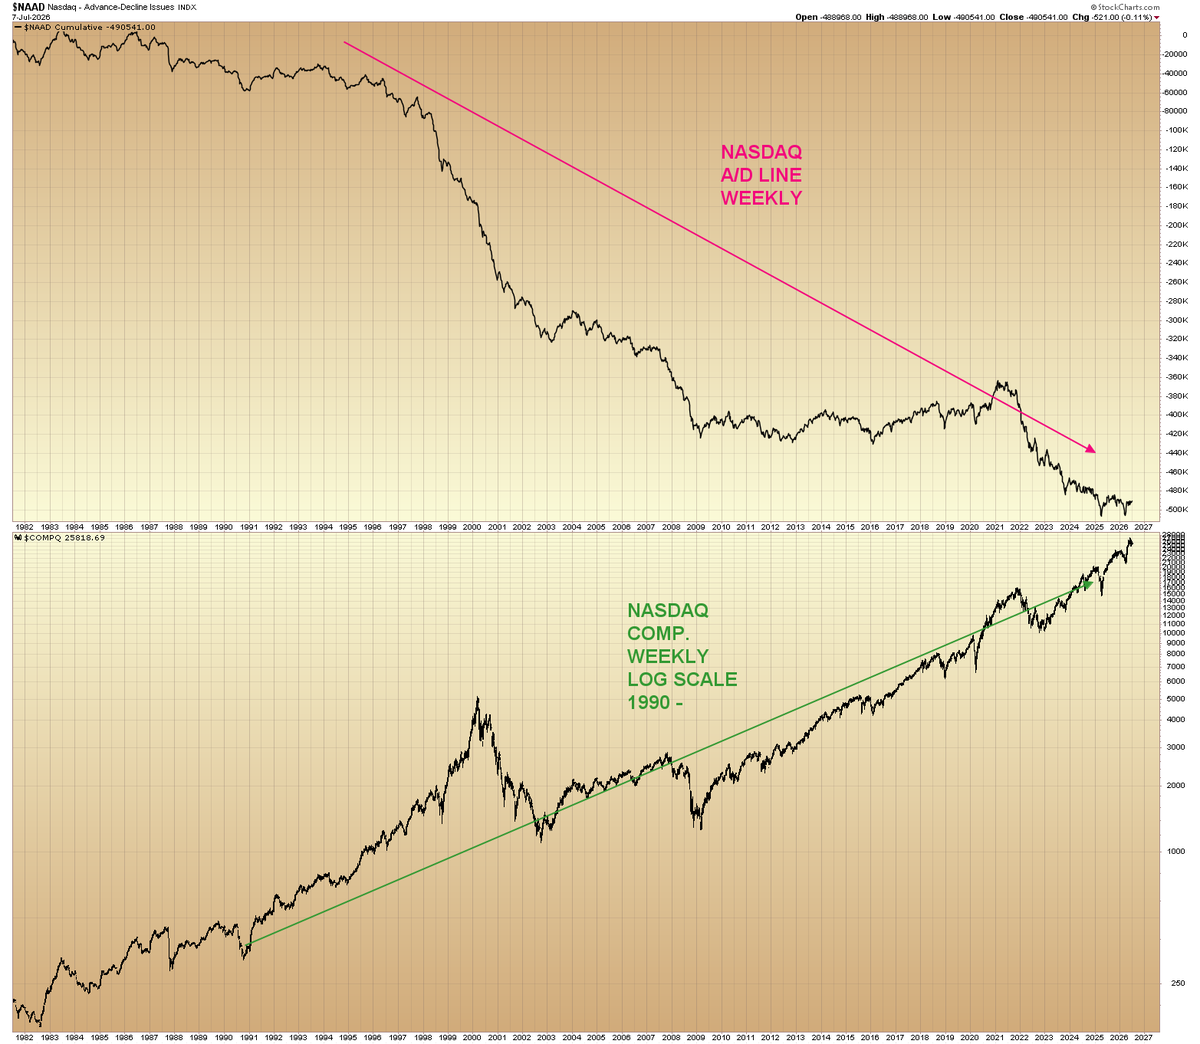




The success of your charting is not evaluated by its prediction or its capability of forecasting a move, it's success comes from the identification of a valid level recognized by market participants, that produces a directional move to profit from, once breached.

