Sabitlenmiş Tweet

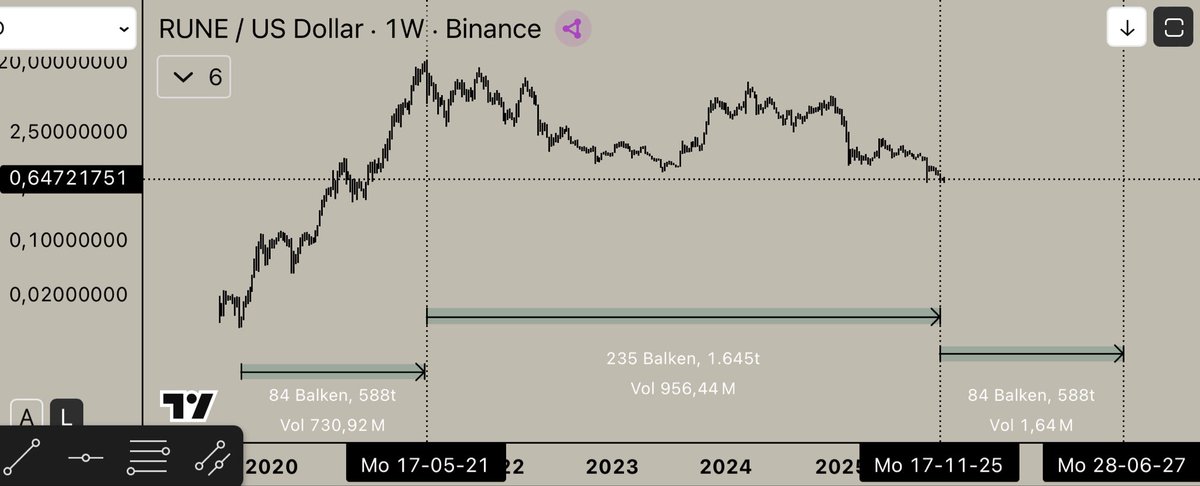
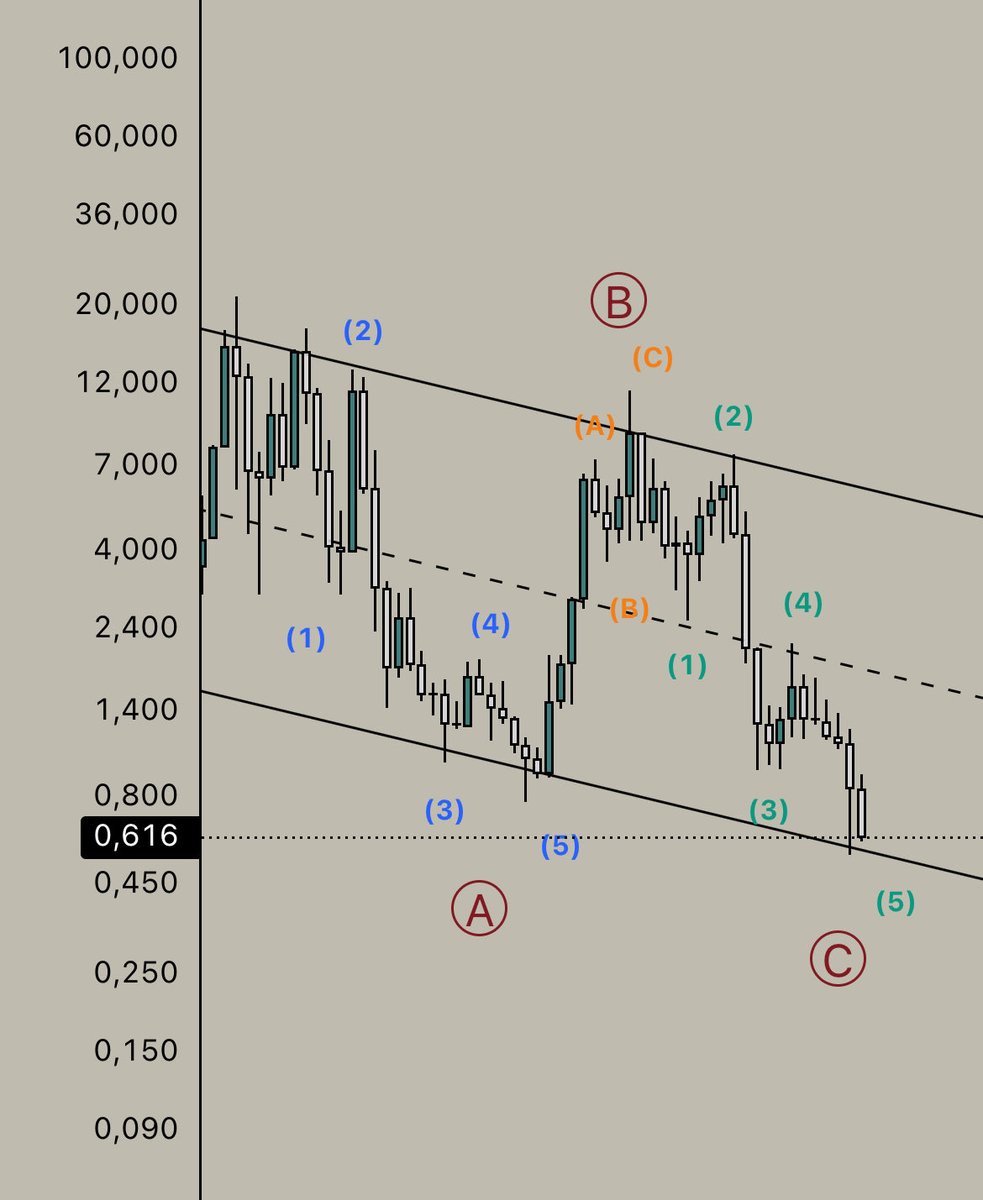
Monthly $Rune Chart
Would be a perfect ABC-Correction
We are in the final phase of this correction (5th wave in the C-Wave)
Don’t be frustrated, be patient THORchads 🧘🏽
English
Maxim.Thor
1.2K posts

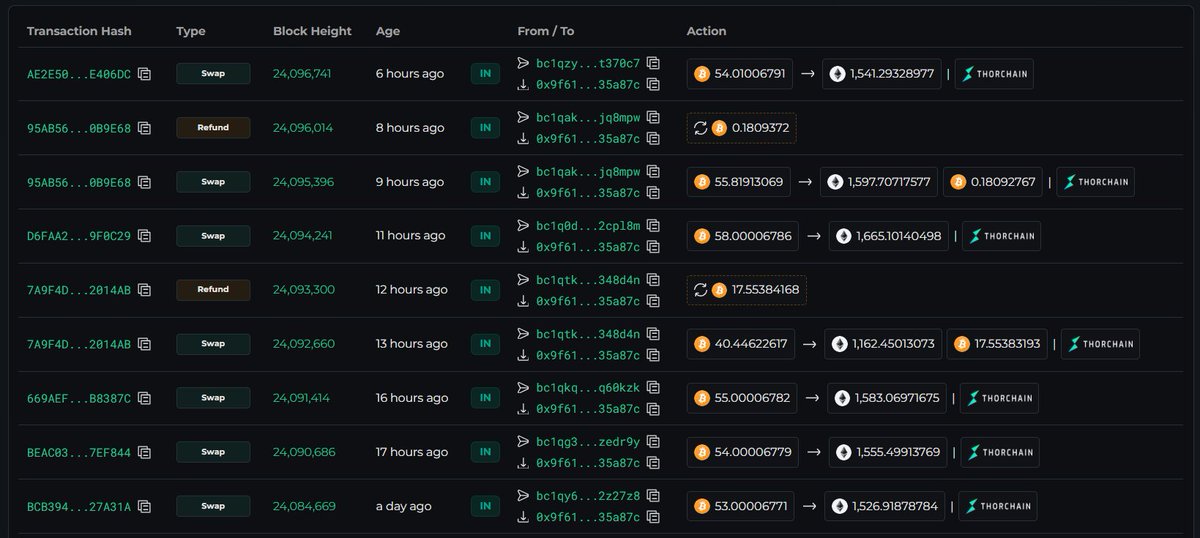
DID YOU KNOW? THORChain's memoless swaps let you use hardware wallets without connecting them to any interface. 🧠 Send native $BTC directly from your Ledger. Receive native $ETH back. Your device stays cold the entire time. No browser connection, no hot wallet exposure, complete self custody throughout. Security without compromise. 🔐 @Ledger @Trezor @unruggable_io @Tangem


In my view, $RUNE will be the lead runner in the coming quarter.

JUST IN: 🇫🇷 France's third-largest bank 'BPCE' to allow customers to buy and sell Bitcoin, ETH, SOL, and USDC.