MIDAS

3.3K posts

MIDAS banner
MIDAS

MIDAS

@Midas1crypto

Me

DUBAI Katılım Mart 2022
641 Takip Edilen309 Takipçiler
MIDAS
MIDAS@Midas1crypto·
@snowinjon @Cart3rWest Bro why r u replying to these retards.. keep doing good work. Ignore the haters
English
1
0
1
86
Snow ❄️ | Quant
Snow ❄️ | Quant@snowinjon·
@Cart3rWest Which message? Show me Screenshot? And yesterday also I tweeted don't get manipulated. You wanted a reply from me, you got it. Now are you happy?
English
1
0
0
213
Snow ❄️ | Quant
Snow ❄️ | Quant@snowinjon·
Everyone was waiting for tonight's deadline. US-Iran talks just got extended by two weeks. I told my group on April 5th that the window was mid-April to last week of April. The extension lands exactly in the timeline I already gave on BTC before anyone knew there would be one. I don't follow the news. The news follows the chart. Receipts below.
Snow ❄️ | Quant tweet media
Snow ❄️ | Quant@snowinjon

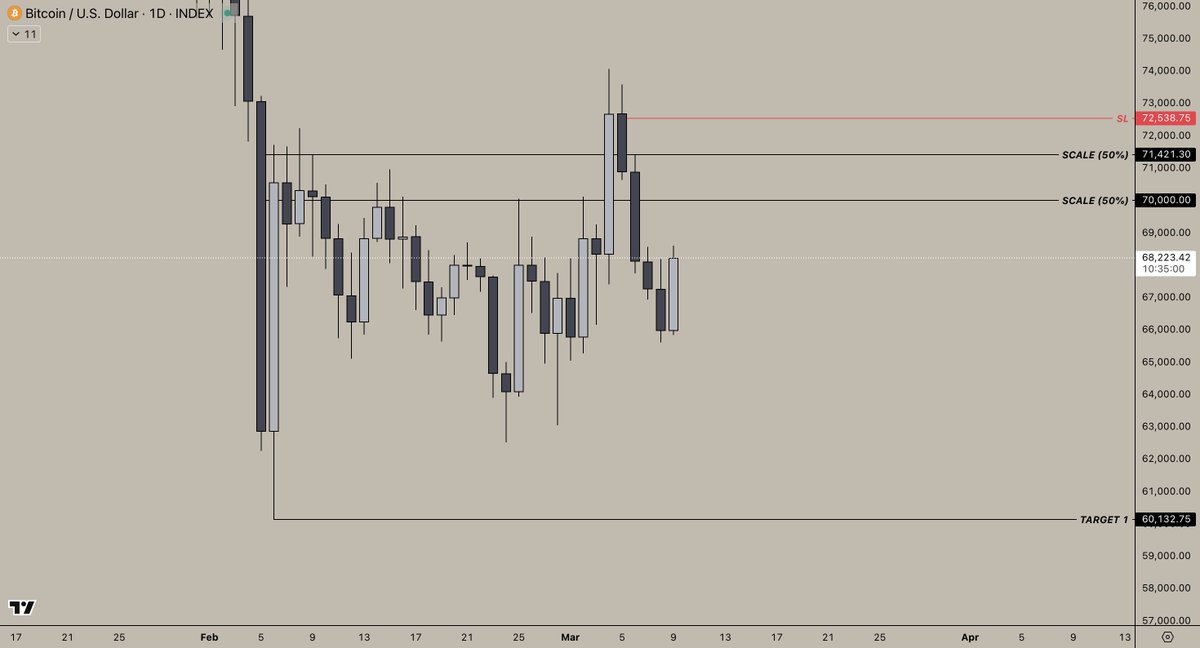
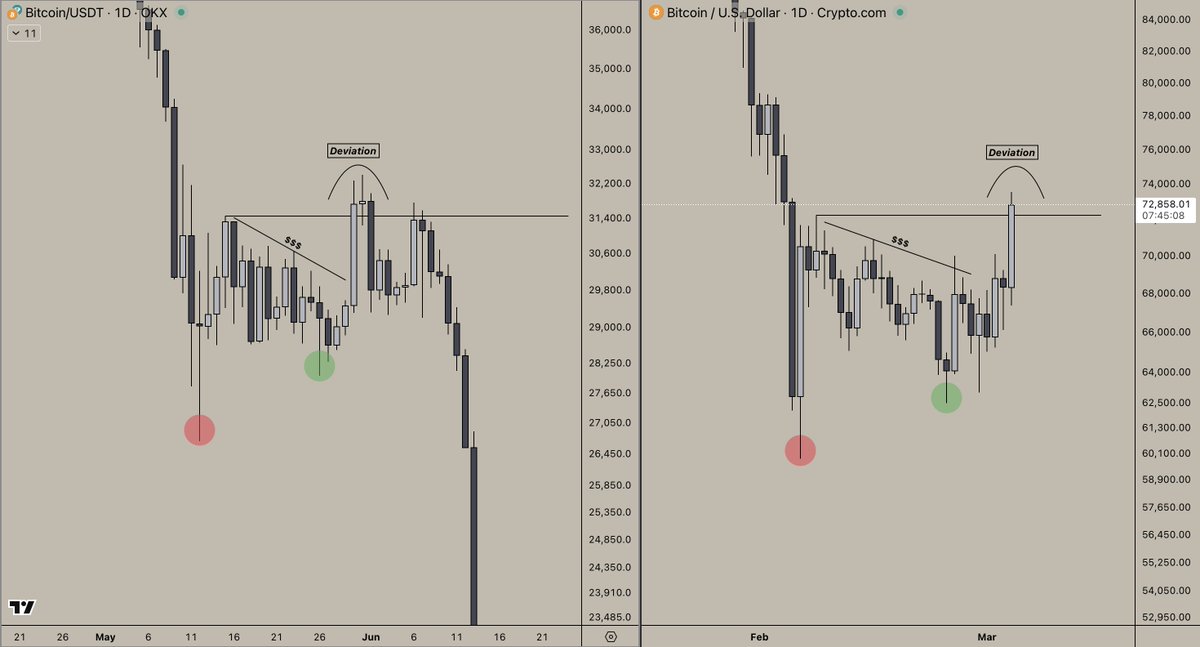
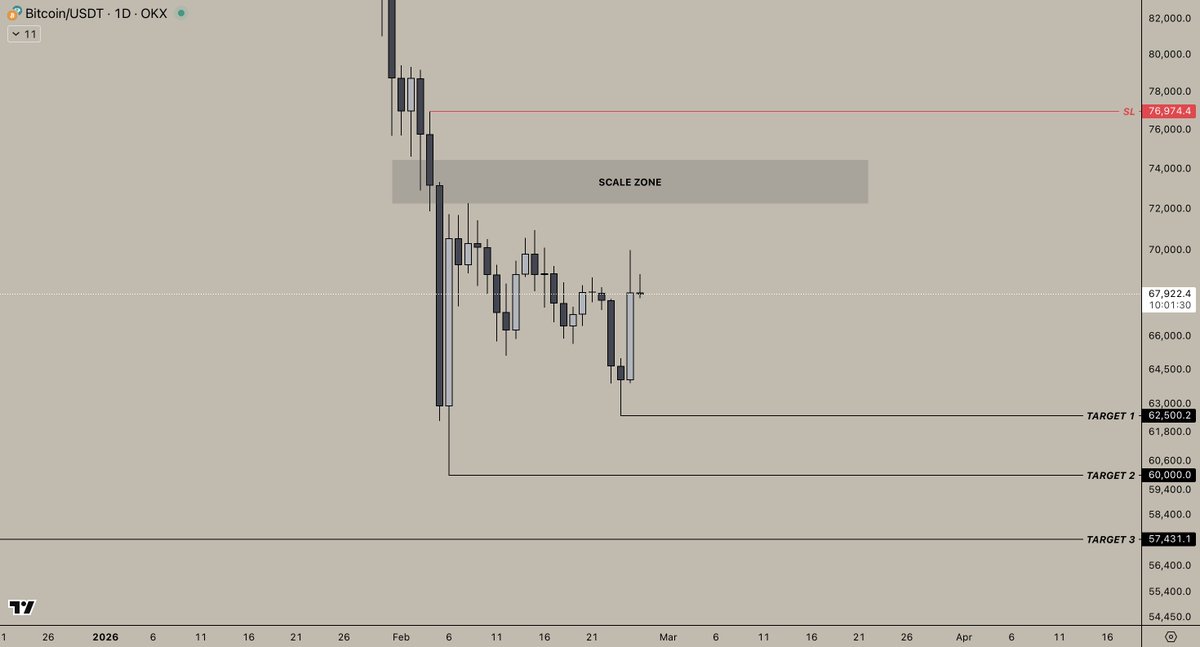
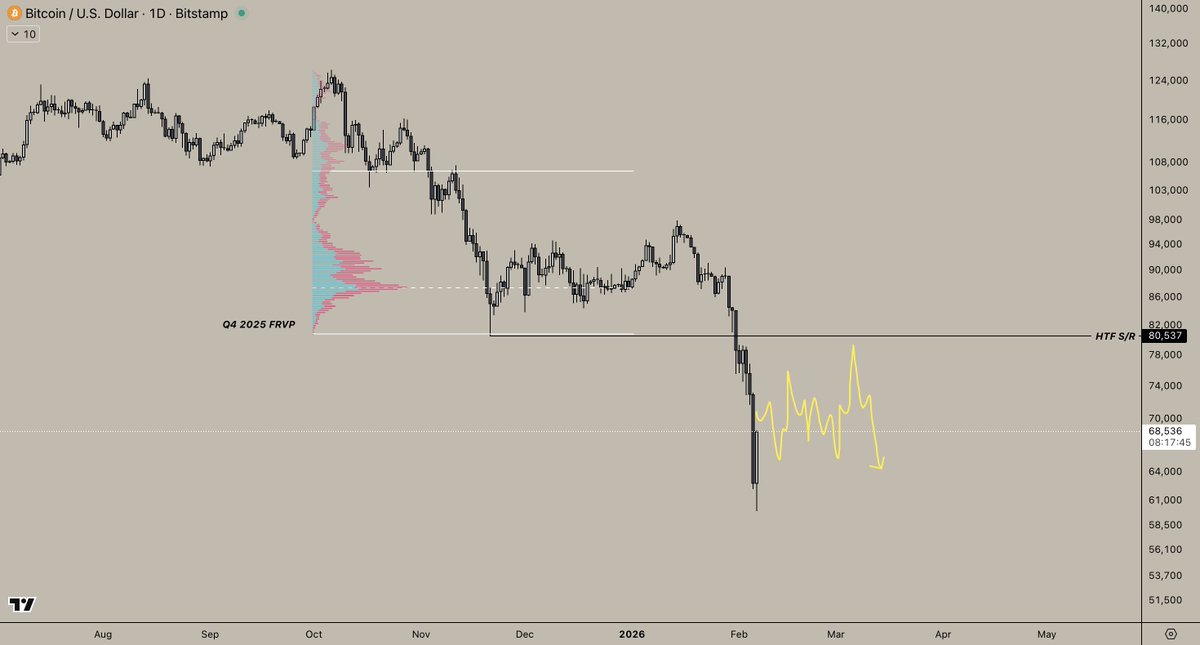
This is the HTF plan for BTC. We Long here (whole Green Box) towards the Red Box which is our Short zone.

English
5
4
36
13.9K
MIDAS retweetledi
Philip Wsol
Philip Wsol@philipwsol·
Upon a retest of the 70-71.5k zone, I will be scaling into a secondary short. The first short with an average of 73k is still open and I'm leaving that one un-touched in terms of profit taking. With that being said, the SL is now at BE completely removing risk. This second short is primarily about catching the bearish re-test after acceptance back into the range, if presented with the opportunity. SL is relatively tight keeping risk controlled in the scenario Bitcoin breaks out of the range and wants to test higher HTF levels. Risk is maxed at 1% for this trade.
Philip Wsol tweet media
English
0
3
16
797
MIDAS
MIDAS@Midas1crypto·
@philipwsol finally got the pump and exit.. started some shorts... adding on swing failures. lfg
English
2
0
2
94
Philip Wsol
Philip Wsol@philipwsol·
"No, please no, not again, anything but that". I'm not joking with the simulation talk.
Philip Wsol tweet media
English
3
2
10
1K
Philip Wsol
Philip Wsol@philipwsol·
Im scaling into shorts in the 72-74k area. In a previous post I mentioned the recent move down as deviation below the range since price was able to climb back above 65k. Now comes the deviation above the range. Don't fade historical patterns✌️
Philip Wsol tweet media
English
2
3
9
1.6K
MIDAS
MIDAS@Midas1crypto·
@philipwsol Yep I'll keep playing while it keeps working..
English
1
0
1
32
Philip Wsol
Philip Wsol@philipwsol·
You know the saying... History doesn't repeat, but it often rhymes. $BTC
Philip Wsol tweet media
English
3
3
10
364
MIDAS
MIDAS@Midas1crypto·
@philipwsol The gift that keeps giving... too much winning lol
English
1
0
1
38
MIDAS
MIDAS@Midas1crypto·
btc..Look for a quick sweep of the lows to 64k or lower .. long then for a good bounce to 72k
English
0
0
0
16
Philip Wsol
Philip Wsol@philipwsol·
$BTC This is what you should be observing for the next 1-2 weeks. It goes without saying that BTC has tracked the 2022 bear market quite well; upon continuation of this, we should conclude this current week with a sweep of 65k and acceptance back into the range. I will personally be going long upon a sweep of 65k.
Philip Wsol tweet media
English
1
3
15
425
MIDAS
MIDAS@Midas1crypto·
@philipwsol good idea.. i've already nibbled a bit and will stagger buys all the way down to 62.5.. expecting a quick flush to at least 64 then bounce up for a week or so to range highs at 72
English
1
0
1
50
MIDAS
MIDAS@Midas1crypto·
@philipwsol Its just incredible how closely it's following the 22 fractal..
English
1
0
1
30
MIDAS
MIDAS@Midas1crypto·
@philipwsol Yes expecting a push upto 70
English
0
0
1
42
Philip Wsol
Philip Wsol@philipwsol·
The purple zones are Asia sessions, the green zones are New York sessions. $BTC As seen on the chart, we have many unswept session highs. Don't be fooled, market movers intentionally manufacture plenty of unswept highs with the intention to later sweep those said highs once sufficient liquidity is built. The time will come.
Philip Wsol tweet media
English
1
2
11
716
Philip Wsol
Philip Wsol@philipwsol·
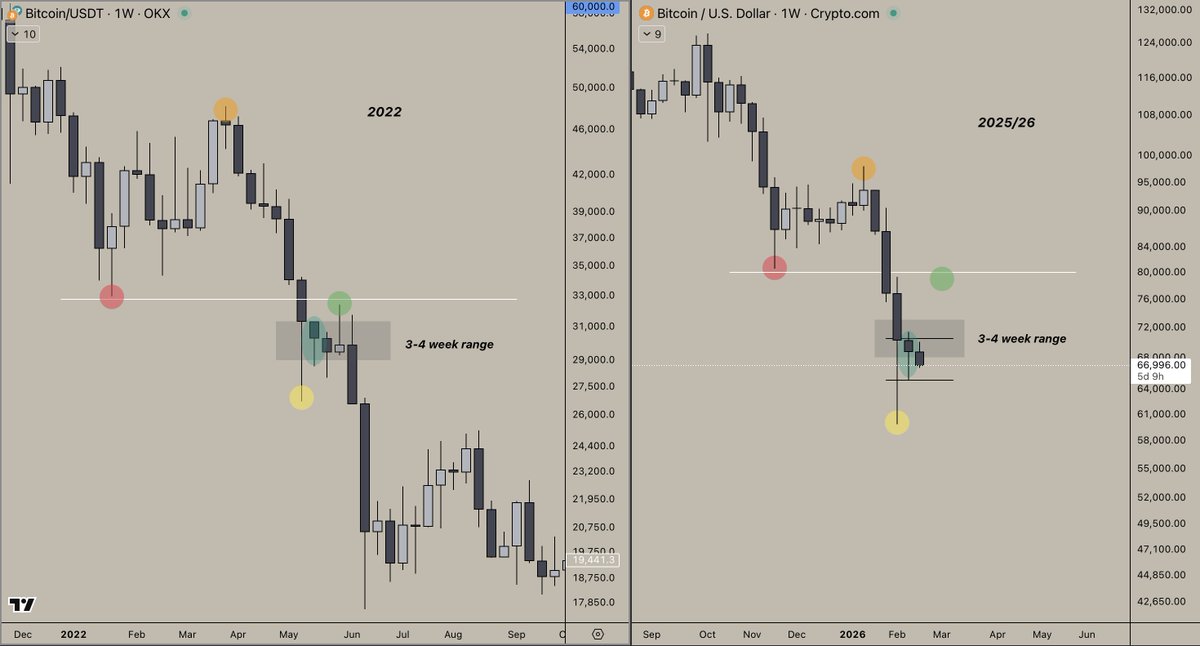
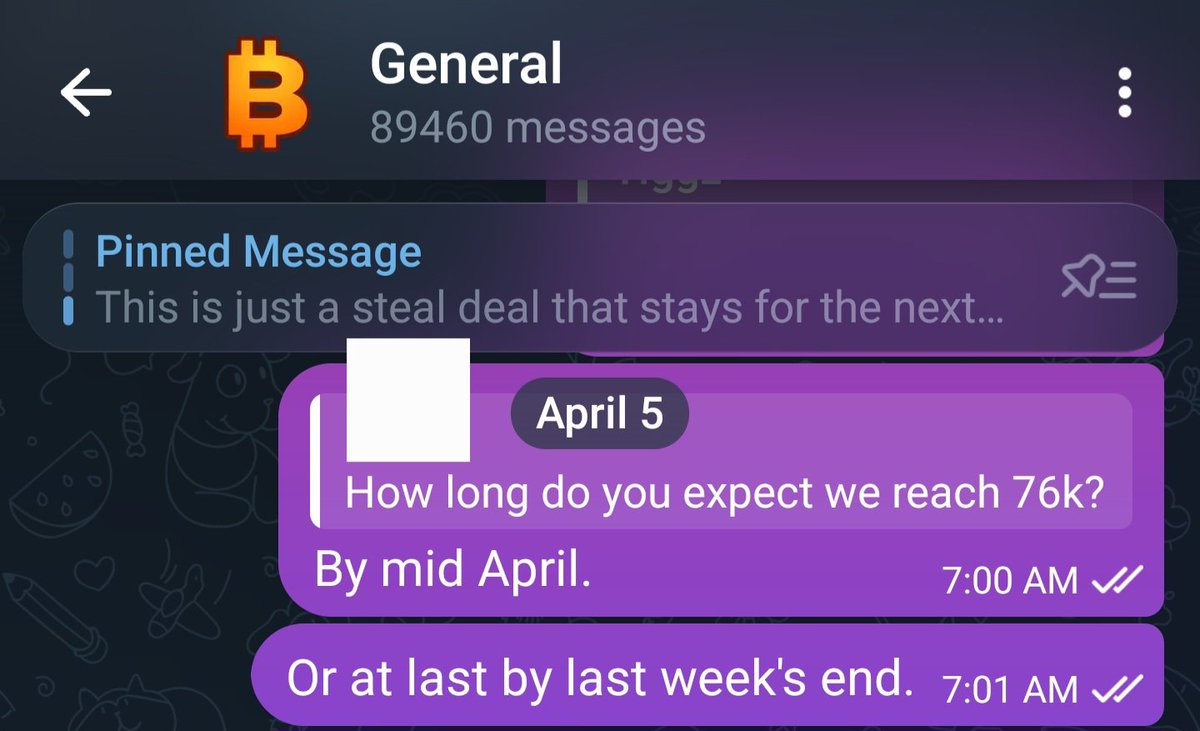
I know you may not want to believe it... But the simulation must continue. $BTC
Philip Wsol tweet media
English
1
3
11
988
MIDAS
MIDAS@Midas1crypto·
@philipwsol It looks like we've already seen the local top if 2022 is anything to go by.. range now between 65-72 until end of the month, then down another leg to take out the aug 24 lows
English
1
0
1
112
MIDAS
MIDAS@Midas1crypto·
@philipwsol Finally an account with true alpha.. i share some of the same methods of analysis.. ur insights been on point fr.. g8 work.
English
1
0
1
138
MIDAS retweetledi
Philip Wsol
Philip Wsol@philipwsol·
On the most recent capitulation, $BTC officially dropped more than 50% from its ATH. The significant volatility we've experienced over the past 3 weeks leads me to believe we'll likely form a new range at these levels before continuation lower. The Q4 2025 VAL is at 80.5k ~ this level will be important to observe.
Philip Wsol tweet media
Philip Wsol@philipwsol

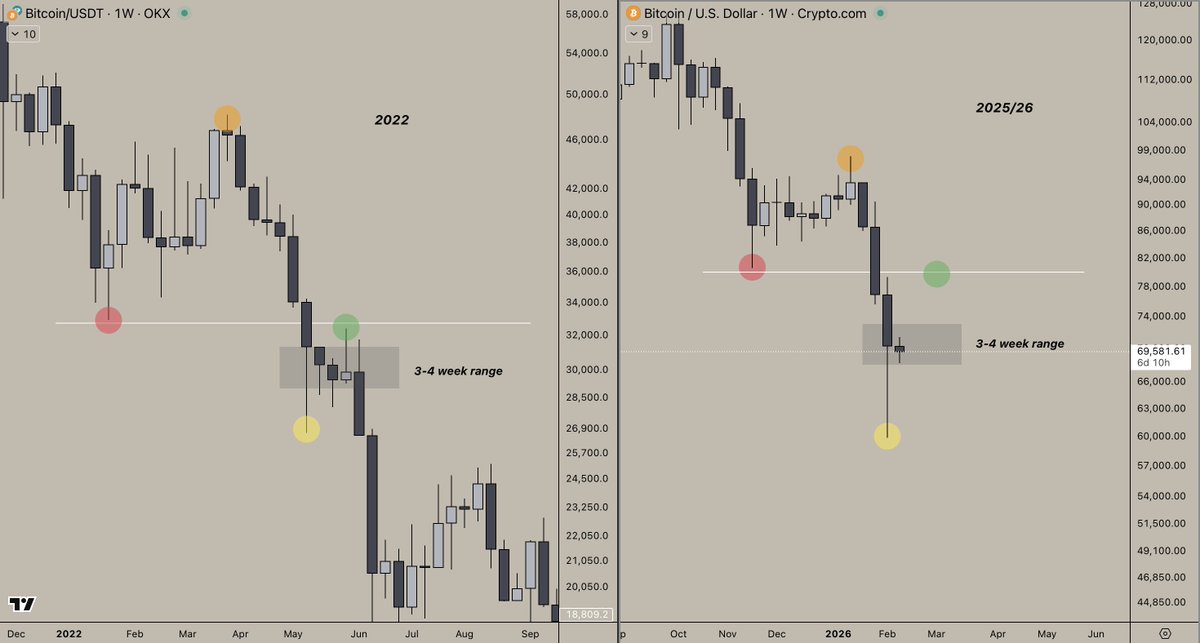
Made this post on Nov 19th, 2025. Not a bad call I guess.

English
1
3
15
888
MIDAS retweetledi
Snow ❄️ | Quant
Snow ❄️ | Quant@snowinjon·
Altcoins can drop another 25%-45% from these prices. They are never cheap. Ofcourse not always in a straight line.
English
9
2
51
18.4K
MIDAS retweetledi
tclow.sats
tclow.sats@tclowdotsats·
after the year we've had in ordinals, if you're still here, you're retarded but after a few cycles, i've learned that that is precisely what you want to be so cheers to being even more retarded in 2026 fam
tclow.sats tweet media
English
12
4
29
758
MIDAS retweetledi
𝙲𝚘𝚕𝚒𝚗 𝚃𝚊𝚕𝚔𝚜 𝙲𝚛𝚢𝚙𝚝𝚘 🪙
- The Unemployment Rate is still rising. - The Fed Funds rate still hasn't dropped back near 0%. - U.S. Credit Card debt is at highest-ever levels. - The Yield Curve inverted the most it's been in many decades, just a few years ago. - Stocks are soaring to new ATHs. These were the same ingredients present prior to large crashes. This is not an *immediate* indicator. It's a very zoomed-out, macro indicator (it's slow and takes a long time to play out). THE HISTORICAL PATTERN: 1. The Yield Curve inverts and Unemployment Rate begins rising and goes parabolic. 2. Fed raises interest rates and keeps them elevated. 3. Fed eventually drops rates. Around this time we see the stock market top. Credit card debt also peaks. 4. The market bottoms, usually after a big crash (such as in the Dot Com crash, GFC, and even the covid Pandemic followed this pattern). As the Unemployment Rate hits "escape velocity", I think we're going to see an event (a large, economic crash event) that causes the Fed to massively initiate QE in response to it. Could be in 2026. This indicate the stock market top could be coming "soon", if it isn't in already. Remember, "soon" with macro indicators could be 6 months (just making up a number, as nobody knows, but I'm painting the picture that it's not necessarily immediate). I could see this upcoming crash timing with a sudden plummet in ISM's PMI (aka "the business cycle") followed by a massive climb, as we saw in the last PMI cycle [not pictured, but go check it out]. By the way, that is what finally would give us EUPHORIA in our crypto cycle and also an actual Altseason. All of the above is my prediction. The timing is the very difficult part. I already got the timing wrong on this a few years ago (I openly admit this!), BUT the thing is-- the cycle hasn't finished playing out because the Fed Funds rate is STILL ELEVATED and unemployment is still climbing. It's just happening in very slow motion-- much slower than I thought it would. Yes, I got the timing WRONG. That doesn't mean the idea is wrong. It's still going through the steps and hasn't stopped doing so. The invalidation of this thesis is that the Fed Funds Rate going back toward 0% WITHOUT some massive crash. THEN you can call this theory incorrect. Unemployment dropping back to lower levels and not finishing its parabolic move that has already begun would also be an invalidation. So, there you have it. Actual invalidation levels! This post is me just very quickly jotting down ideas because I wanted to get my thoughts out. Consider it a rough draft. I need to spend more time articulating this all, clearly and more exactly, probably in a video with charts. Please view the attached chart in full 4K, high resolution, as the detail is important. On X (mobile app), you can load this in full hi-res by pressing the three dots "..." on the top right corner of the post and selecting "Load in 4k". Lastly, I expect the ideas in this post to be met with doubt, mockery and derision. It's the nature of reaction toward any non-bullish talk, and it's the nature of going against the herd. I expect this fully. I'm also aware that "Even a broken clock is right twice a day", inferring that if one "cries wolf" long enough, he eventually will be right. This trait is attributed to many doomsday callers. I will just say that I have laid out the invalidation points above (Fed Funds dropping to 0% without a stock crash, as the main one) and if it is reached then this forecast was wrong and I will gladly admit it. But as long as the Fed Funds rate is way above 0% and Unemplyoment continues to rise, the pattern has not finished playing out. You can't call it failed until it has actually finished playing out: 1. The Yield Curve inverts and Unemployment Rate begins rising and goes parabolic. 2. Fed raises interest rates and keeps them elevated. 3. Fed eventually drops rates. Around this time we see the stock market top. Credit card debt also peaks. 4. The market bottoms, usually after a big crash (such as in the Dot Com crash, GFC, and even the covid Pandemic followed this pattern).
𝙲𝚘𝚕𝚒𝚗 𝚃𝚊𝚕𝚔𝚜 𝙲𝚛𝚢𝚙𝚝𝚘 🪙 tweet media
English
11
18
164
35.3K