

Mike Farrell
384 posts


When you’re bullish the entire way down during a decline it’s a joke to brag how bullish you are at the bottom
English

@Chartfest1 When I voted there were 636 votes. Final results: 477. Elon has screwed something up. Badly.
English

@Chartfest1 @go_klaus DWA did back in the day.
A good thing to do. Gotta love buy signals😀
English
@Chartfest1 @go_klaus One of the oldest out there
But who’s counting :)
English
@Chartfest1 @go_klaus Yes, it is an oscillator. NDW tracks 40 sub indexes with this oscillator and it reversed up on the 3 box method from a low level but not oversold. Thursday, semis reversed up
Combine this with Positive Trend which has yet to reverse down on NYSE.
English
@Chartfest1 @go_klaus How it Works
Unlike standard market indexes (like the S&P 500) which are heavily skewed by mega-cap stocks, the BPI treats every stock equally. [1]
•Buy vs. Sell Signals: Every stock in the index is evaluated using a P&F chart. A stock is either strictly on a buy signal or a
English
I never thought that Jim Cramer and Walter Deemer would have something in common @jimcramer @WalterDeemer
Walter Deemer@WalterDeemer
Back in the 1960s there was a company called National Video. They made color television picture tubes, and were the first to produce a 23-inch rectangular color TV picture tube. It quickly became the industry standard, and every major TV set producer scrambled to get their hands on National Video’s picture tubes. They literally couldn’t make them fast enough. The stock went from a low of 15 in 1964 to a peak of 120 in October 1965. The final 70 points came in just the last few months. Eventually, though, the Motorola’s and Zenith’s of the world produced their own color TV picture tubes. They didn’t need National Video’s any longer. The stock went from 120 to a low of 40 in 1966, 15 in 1967, and then to zero in 1968 as the company went bankrupt. The poor thing couldn’t even make it to the Go-Go years. In those days, Mueller and Company produced tick volume charts. National Video’s chart depicted the stock going from Northwest to Southeast in a straight line while the tick volume line went straight up. The stock was a fundamental short. In those days, short sales could only be executed on an uptick. Which meant the whole world was always offered up an eighth. Oh, National Video’s ticker symbol? NVD.A. This story is true, but any resemblance to any other companies is purely coincidental.
English
@DougKass @CNBC @TheJudgeCNBC As the headline says, he also called for the S&P 500 to end 2026 at 7700- a 10% increase. So, what is your point as usual.
Dougie, does not get the call anymore - for good reason
However, Mr. Yardeni blew his call in 2022 with his inflation call not being an issue on S&P 500
English

Dr/ Ed Yardeni is on @cnbc with @TheJudgeCNBC now.
In the interest of full disclosure your guest Ed Yardeni recommended the reduction in hyperscalers/MAG7 on December 25, 2025 - since they accounted for too large a portion of the S&P 500 Index. At that time he suggested their margins would shrink.
Ed recommended diversifying into the wonderful 493... especially financials (which subsequently have underperformed this year).
This is not ad hominem. I didn't make this up.
Here is his video on @cnbc of his appearance:
"Underweight Mag 7 stocks, diversify into the 'impressive 493' in 2026"
cnbc.com/video/2025/12/…
Ed has conveniently forgotten this and no one on @cnbc has followed up on that recommended action.
This is the problem with Fin TV... access is more important than substance and the interest of viewers.
Guests polish their brands my sweeping mistakes under the rug and emphasizing their good calls.
@KeithMcCullough @SamofAmerica @RPKent @HedgeyeDJ @tomkeene @business @ferrotv @annmarie @business @SquawkCNBC @andrewrsorkin @beckyquick @cnbcfastmoney @HalftimeReport @saraeisen @SullyCNBC @peterboockvar @guyadami @WhitneyTilson
English
@Chartfest1 BP and PT both drifting below 50%. Moving above 50% would be good
English
If you guys dont get the SPX green by the close I will be disappointed.
English
@SaraEisen He also accelerated the rising difference between rich and poor regarding assets. We now have a socialistic surge.
English
Jay Powell’s last day as Chair is tomorrow, wrapping up 8 years of leading the Federal Reserve. His legacy: a champion for Fed independence, saving the world economy from a deep depression during the COVID shutdown, and fighting 41-year high inflation without wrecking the economy or jobs, achieving the rare soft landing.
English
Compelling Stuff
Wayne Whaley@WayneWhaley1136
THREE CONSECUTIVE +3% S&P WEEKS As reported by many, the S&P has posted three consecutive +3% weeks (+3.36, +3.55 & +4.53%), a feat that has only been accomplished twice before since 1950, once in the week ending on Sept 3, 1982 and again 38 years later on the week ending June 5, 2020. As is their nature, the Bulls have embraced those two data points as they were followed by +34.5 and +32.4% S&P gains in the following 12 months. Being one who would prefer to have more than two data points to support decisions impacting the equity risk associated with my family's investments, I thought it possibly worth the effort to survey all fifteen trading day sequences since 1950, regardless of the day of the week upon which they fell upon, defining the first five days to be the first week, Days 6-10 to be the second week and Days 11-15 to be the third week, rolling three week proxies if you will. This would give us roughly five times as many data points in our sample set to review vs using strictly calendar weeks ending on Fridays. In this second scan, there were eight cases which met our three consecutive +3% week constraint, including the two aforementioned cases that were based on actual calendar weeks and are yellow highlighted in the table below. The results of those eight cases would do little to dampen the Bulls enthusiasm for this setup given that, In all eight cases, the S&P was up at least 3%, one Quarter later for an avg Quarterly gain of 8.37% & In all eight cases, the S&P was up at least 6%, six months later for an avg six month gain of 15.2%. The one slightly tainted data point was the 1987 case which is the obligatory Perfect Thrust Study buster, in that it was launched in January with all the classic thrust signal characteristics a quant might covet which was then followed by a 20% advance into August but was brought to its knees in October by a vicious assault upon double digit interest rates which led to the Black Monday on October 19 you may have heard speak of. One of 18 studies that the 14 markets I follow presented to me this week which were shared with my Market Study subscribers this week ~ waynewhaley.witterlester@gmail.com
English
@Chartfest1 BP bank at 74% and PT bank at 80%
Lets call another, it’s over before any real pullback and bounce
Yes, XLF is under performing. How long ago was XLK underperforming. Yes XLK is overbought
English
@CNBCFastMoney @GuyAdami @timseymour @StocktonKatie Or Perhaps Dan Nathan. Endless dribble for the last 9 months of we know it is going to happen. Meanwhile, any followers missing a generational run in SMH stocks as we know it will not last. He has no real foresight in the real question. When. Bull market continues.
English

Is the consumer in trouble?
Retail stocks coming under major pressure as investors look ahead to earnings from $WMT, $TGT, $HD and more. @GuyAdami, @timseymour, Dan Nathan and @StocktonKatie debate what the weakness is signaling.
cnbc.com/video/2026/05/…
English
@LWillson_82 You’re a public figure who does not deserve much.
Your cartoon is at best cute. Same old , potatoe, potato
Your game hasn’t changed and continues to be juvenile
English

Couple small updates:
I’m retiring the word “numpty” this upcoming CFL season. It served its purpose.
I will instead be using the term “potato” very interchangeable really. Can be used many ways:
“Dudes a potato”
“What a potato”
“This idea must have come from a potato”
ALSO:
I would like to apologize for a section of a tweet I used two days ago while criticizing the upcoming changes to the CFL playoffs.
I had a long critical tweet that included the following:
“Anyone trying to defend it or rationalize it. Isn’t doing so in good faith (or is clueless).”
I spoke with someone yesterday whom I have a tremendous amount of respect for and someone who has devoted years of his life to the development of the league. I was wrong to add that into the tweet.
Although there are many potatoes out there trying to defend or rationalize it, not everyone doing that falls into that category. The generalization I used is incorrect and I am sorry.
English
In today's Early Look: "Crazy #Quad2?"
How many people in our profession are going to say "this market's crazy" today?
Lots. It usually means they're missing the moves (or they don't realize they're the ones being crazy).
One of the craziest assumptions you can have about markets is that they always make fundamental sense.
They don't. They make fractal sense. Those are very different things.
GIF
English
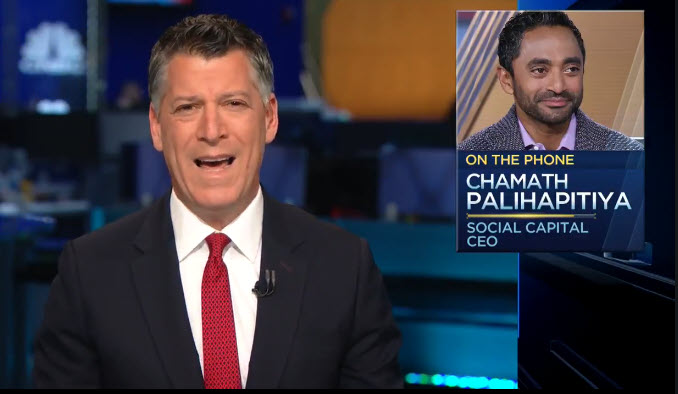
BREAKING: CNBC's Wapner hits a new low in Tone Deaf terms
English
@seer_xyz From what I saw, he went negative on market since Aug 2025 or so and stayed there. We got the Iran pullback. Missed a lot of upside but he made money calling the direction of the market wrong
English

if John the market sleuth can have thousands of paid subs on his substack by simply avoiding trading every day... let me cook $QQQ $SPY im not hating at all, with all due respect, since I came back on X all I see him doing is avoiding trading 6 days a week due to some data release, volatility or the temperature in Mars.
English
@bradyoliveira This is all about trying to create more revenue for the owners. The majority of the players can likely make more money too. The NFL will not follow. It will be a public joke when you are trying to raise the bar
English

8 out of 9 teams in the Canadian Football League playoffs takes away from what makes those games special.
Playoff football is supposed to be earned. If anything, grow the league by adding more teams…. not the number of automatic spots. 🤷🏽♂️
Milt Stegall@MiltStegallTSN
Ask @cfl players how they feel about this new era of playoff football. 8 out of 9 teams making it starting in 2027 instead of 6? I guarantee 100% of them love it. More games, more exposure, more chances to put extra coins in their pockets 💰
English