English
monsterd101
64 posts

Spoke to an AI product leader at a $100bn public company. Their AI strategy isn’t working as planned… Has nothing to do with people. They poached tons of talent from FAANG. Has nothing to do with use cases. They’ve made waves publicly for their early AI wins. Has everything to do with risk tolerance and politics. This company formed an internal AI org to be the service provider of AI needs for the rest of the firm. Because of that, a mandate exists where employees are only able to work with this internal function and no outside AI vendors/software. It’s how this behemoth is controlling risk. Issue is, there are lots of mouths to feed and not enough internal resource. Folks at the company have gotten impatient and are going rogue, pull on outside vendors to help with AI transformation. This is why I believe AI transformation will largely be relegated to outside partners, and why getting enterprise adoption is so damn hard. You can get data right. You can get talent right. You can get use cases right. You can get training right. But the weight of bureaucracy and cultural debt can be crushing and is likely the biggest risk to companies missing out on the value of this technological supercycle.


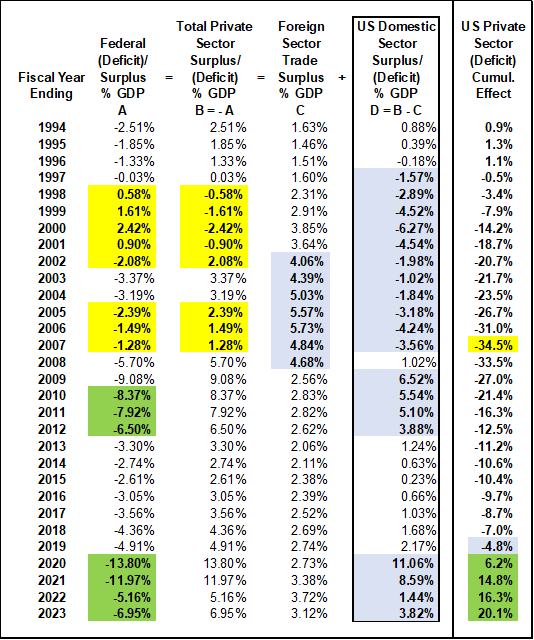
Illustration of what I am talking about using data. I emphasize that this is illustrative (I'm not implying that these columns as % of GDP are truly additive, etc.) But there is some truth to the fact that if the federal govt runs a surplus, then the private sector (composed of both domestic & foreign) runs a combined deficit. 2001 year example to explain the table: col. A) US Govt surplus = 0.90% of GDP, therefore col. B) Total Pvt Sector deficit = -0.90% of GDP, but that pvt sector deficit is made up of domestic & foreign sectors - so let's separate them... col. C) Trade Surplus (Foreign Sector) = 3.64% of GDP, that means by math... col. D) US Domestic Sector = -0.90% - 3.64% = -4.54% (means that US domestic sector ran a -4.54% of GDP deficit (ie added debt to maintain consumption)). The last column is just another illustrative accumulation of domestic sector debt (setting start of 1994 = 0 and then adding yearly domestic sector deficit to get another illustration of a running net increase in domestic sector debt as a % of GDP). This basically shows a huge problem for 1998-2001, a tiny bit of relief from 2002-2004, & then a resumption from 2005-2007 as deficit falls & trade deficit increases significantly. All the while domestic sector debt load is increasing until it blows up in 2007-2008. BTW - I should run this to present day. It will show the rising strength in the domestic sector financial balance sheet (an almost reverse situation to the 1998-2008 decade). You can see the large fiscal deficits after the GFC (& falling trade deficit) helped to rebuild domestic sector balance sheets.


“More than 2 million research papers have disappeared from the Internet” You know I have been saying we are losing more information each day on the internet than is being produced. DO YOU HEAR ME NOW. 2 MILLION PAPERS—GONE. Article: nature.com/articles/d4158…