Sabitlenmiş Tweet

Okay so i've been watching $abcdefg and its community since day 1 and honestly i'm quite impressed with what i'm seeing, the dedication and hard work these guys are quietly putting in is unmatched.
I've spent days on charts and have seen more charts than i've seen sunlight this week...
You start to recognize when something’s different, patterns repeat & behavior doesn’t lie. I'm sure this one’s setting up the same way the big ones did.
$abcdefg has that look and this is one of those charts you don’t fade.
Now let me tell you WHY:
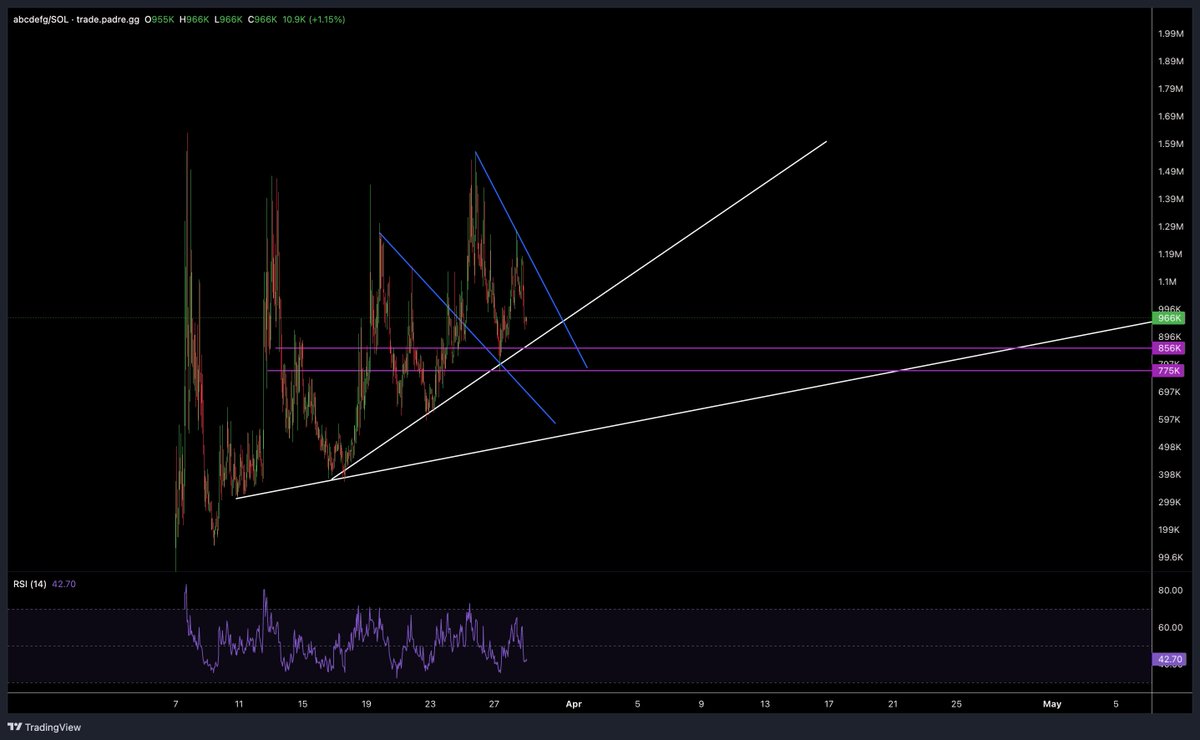
Here is my updated TA on the day timeframe for $abcdefg and honestly-- looks beautiful.
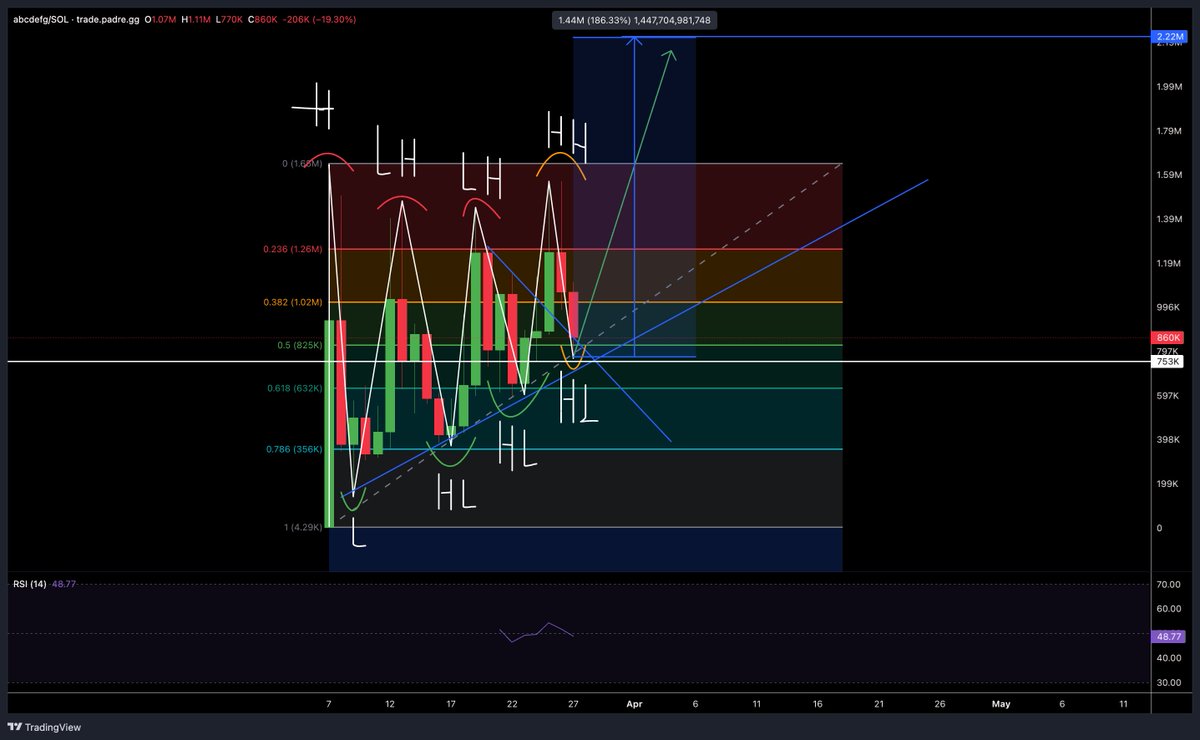
HIGHS: We have a ath (H) of 1.64m followed by an lower high of 1.48m (LH) followed by another lower high of 1.45m (LH), and then finally followed by an HIGHER HIGH of 1.57m (HH).
LOWS: We have an atl (L) of 200k followed by an higher low of 380k (HL), followed by another higher low of 632k (HL) + bounce off .618 level on the fib, followed by another lower high and current lower high of 772k (HL).
Each time it forms a higher low (HL) is pretty bullish
It was forming lower highs (LH) for a while until the most recent breakout which formed a HIGHER HIGH (HH) + a higher low (HL)
So we got current formation/setup of higher high + higher low = bullish asf.
PLUS support/bounces/higher lows off the 0.618(the most bullish) level on the fib, and also current support/bounce/higher low off the 0.5 level on the fib which is also bullish asf.
If it continues to form higher highs + higher lows it'll giga send.
The next leg up must breakout above previous high of 1.57m.
We must hold above the higher low of 772k.
If this happens, then the next time it dips and bounces it have to form a higher low higher than the current higher low of 772k.
If it does all of that then this shit bound for 3-5m
89S7oVB4hui8ceJqhHreWB7fcxdthfvoB7z2pfJtpump
abcdefGM hope you all have a blessed Friday ;)
English