Musubi
111K posts


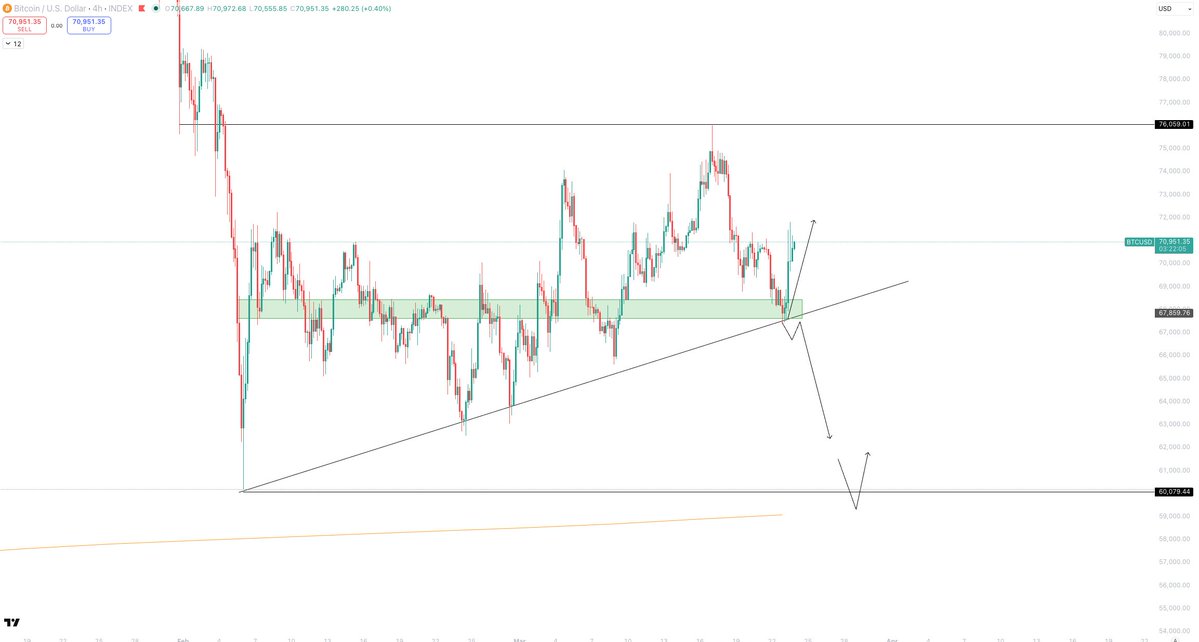
I still think the overall macro bottom is likely in. But as said in the Quoted post, you can never rule out a sweep of the $60k lows. ALOT of fear on the timeline at the moment with Iran... you realise just how bad it is when you step away for a few days and don't use social media. We have the 1W 200 SMA at $58,000, which is definitely a target. I'm sure MM could find something with Iran to get use there. We got a push up with a daily close above the $74,400 2025 yearly low, but failed to hold that area and are now in a bigger range between $60,000 and $76,000. You can't deny that the structure looks very similar to the $98k peak in January... But under the surface is still looking very different. At this point in the last range funding was highly positive, meaning longs were being favoured, and coinbase premium was deeply negative and accelerating fast. This time, funding has been mainly negative and coinbase premium is barely negative. In addition, spot selling from leading exchanges like Binance has been minimal... And long term BTC holders are heavily buying. These are pretty key differences. My personal worst case scenario is a sweep of the $60k lows, potentially wicking down to $56k levels. But I do not think we get another macro leg down. What am i doing from here? Very simple. If we get this $60k sweep I will adding another DCA to my $SOL and $TAO buys Bottoms are boring and unpredictable. Best thing you can do is not overcomplicate it, not try to 100% time it, and just accumulate within these oversold conditions. Nothing about my HTF picture has changed whatsoever. Overall rising fear in the markets and fear in the world tends to mark pivot points. Same with optimism and greed. Just when everything feels like its about to truly collapse does it turn around. Important to step away and recognise this.


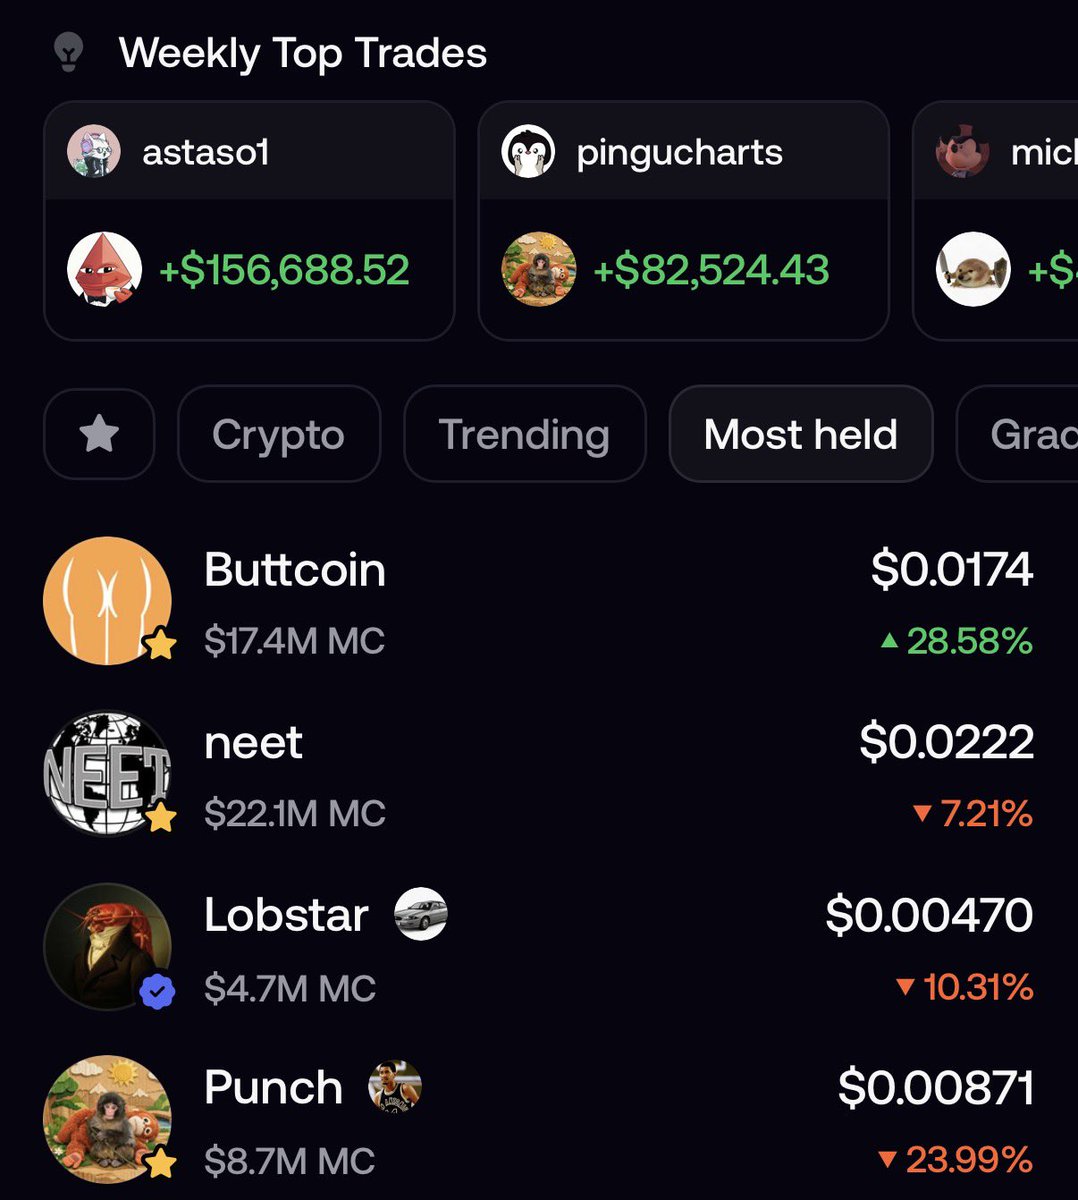
god candle any moment for $buttcoin This is about to get reaaaaalll fun HOLD ON TO YOUR BUTTS!


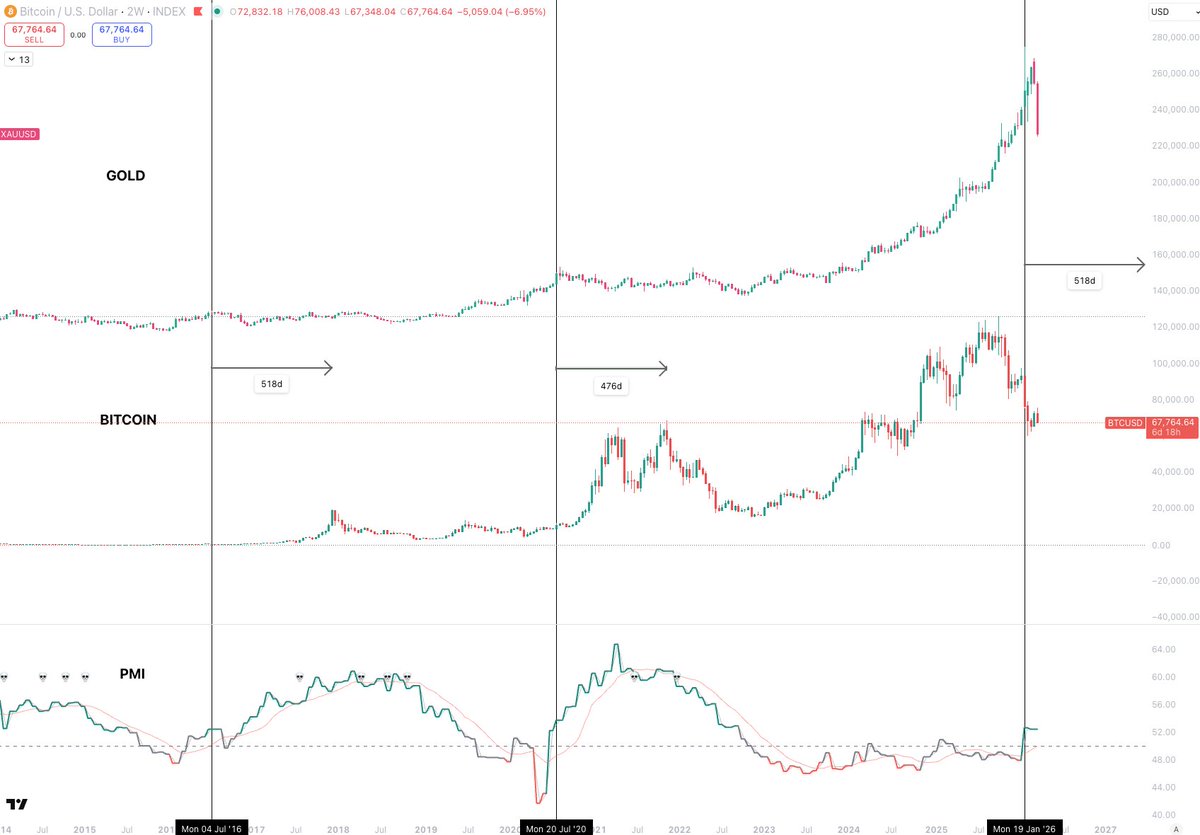
You do not need to overcomplicate it. I don't understand why everyone finds its so hard to see these things. Well, I do, because emotions rule 99% of people. But anyone can line up these three fundamental macro charts and analyse where we are. It literally takes two minutes. In every single cycle we have had: 1. GOLD tops as ISM moves into expansion 2. Bitcoin tops between 476d and 517d after It is very clear to see that. And it is not a coincidence this happens, it happens for fundamental macro reasons. GOLD is a strong risk off asset that performs well in economic and geopolitical uncertainty. When ISM breaks into expansion, that uncertainty is removed and GOLD finds its top, as ISM continues to expand. An expanding economy improves liquidity conditions and that is why Bitcoin then has its turn. Again, this is not a random chart that has no intrinsic link. These three charts represent different stages of a macro cycle and when you put them together, it becomes clear. Take a look at this again now... Do either GOLD or ISM look like they are anywhere near a position that signals Bitcoin having 9 months of a bear market left? Not at all.