NOAA MAPP

255 posts

NOAA MAPP banner
NOAA MAPP

NOAA MAPP

@NOAA_MAPP

MAPP's Program mission is to enhance the Nation's and NOAA's capability to understand, predict, and project variability and changes in Earth's climate system.

Silver Spring, MD Katılım Ocak 2020
123 Takip Edilen921 Takipçiler
NOAA MAPP retweetledi
NOAA Climate.gov
NOAA Climate.gov@NOAAClimate·
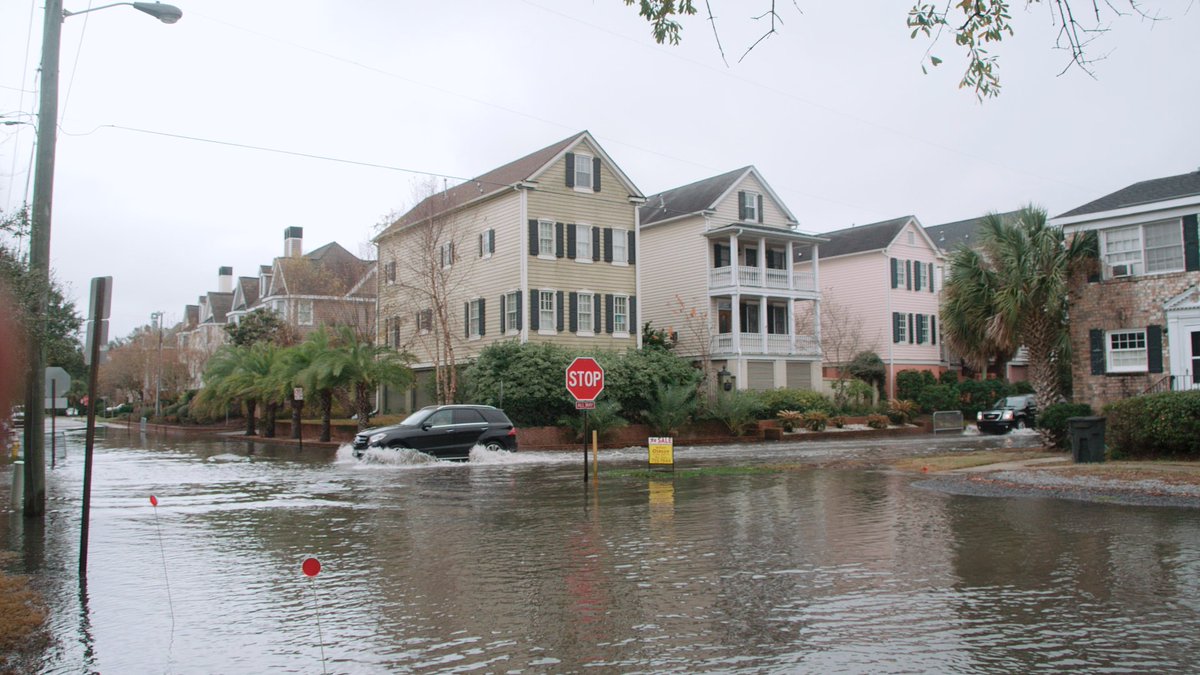
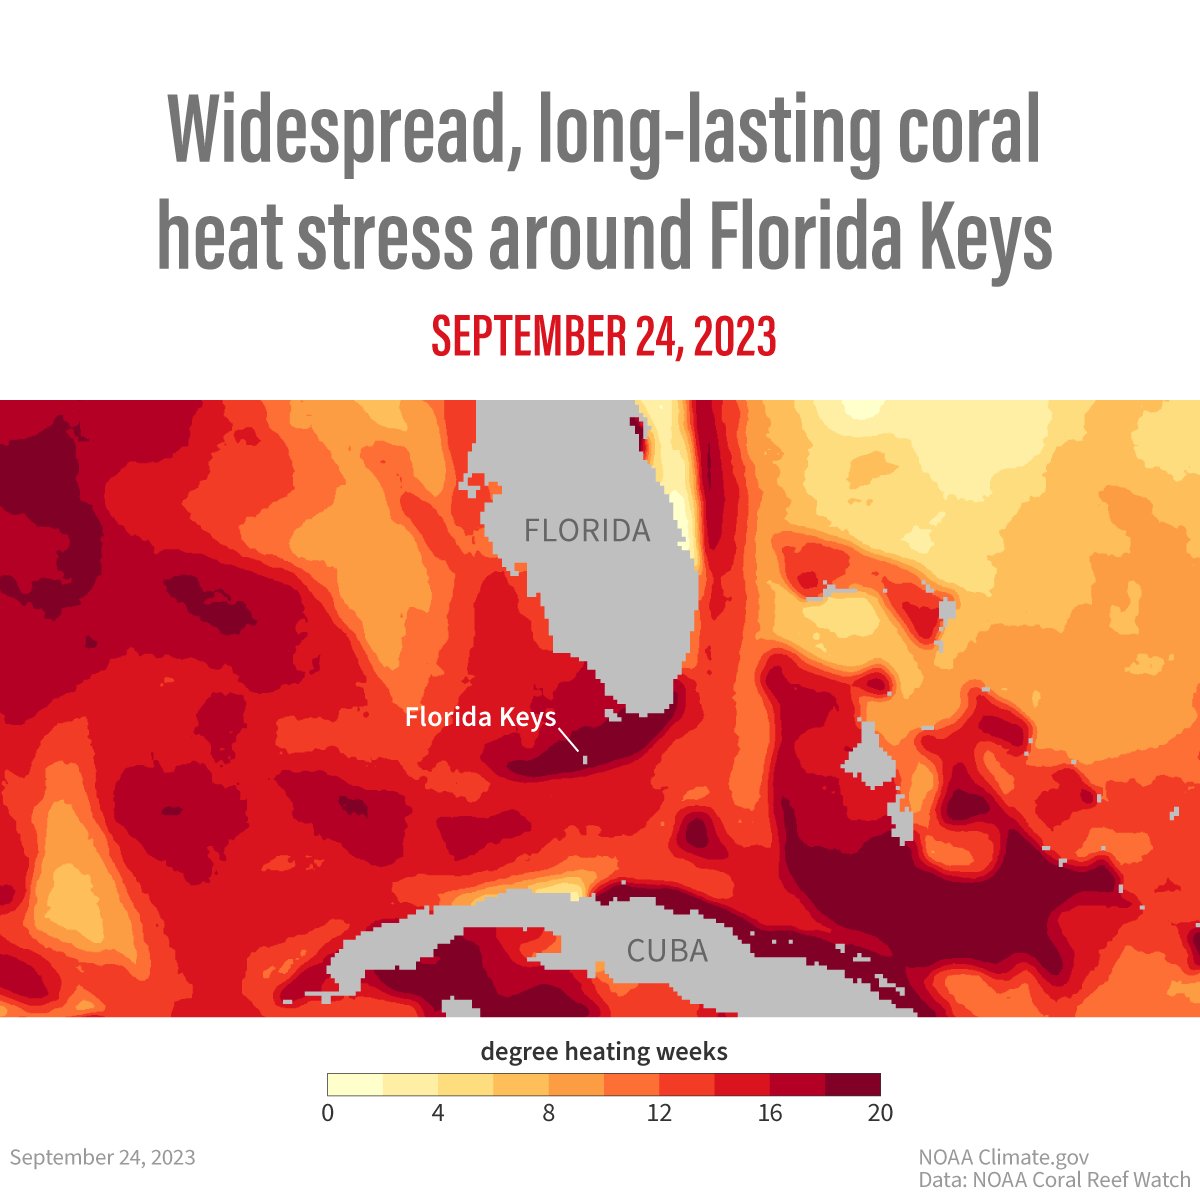
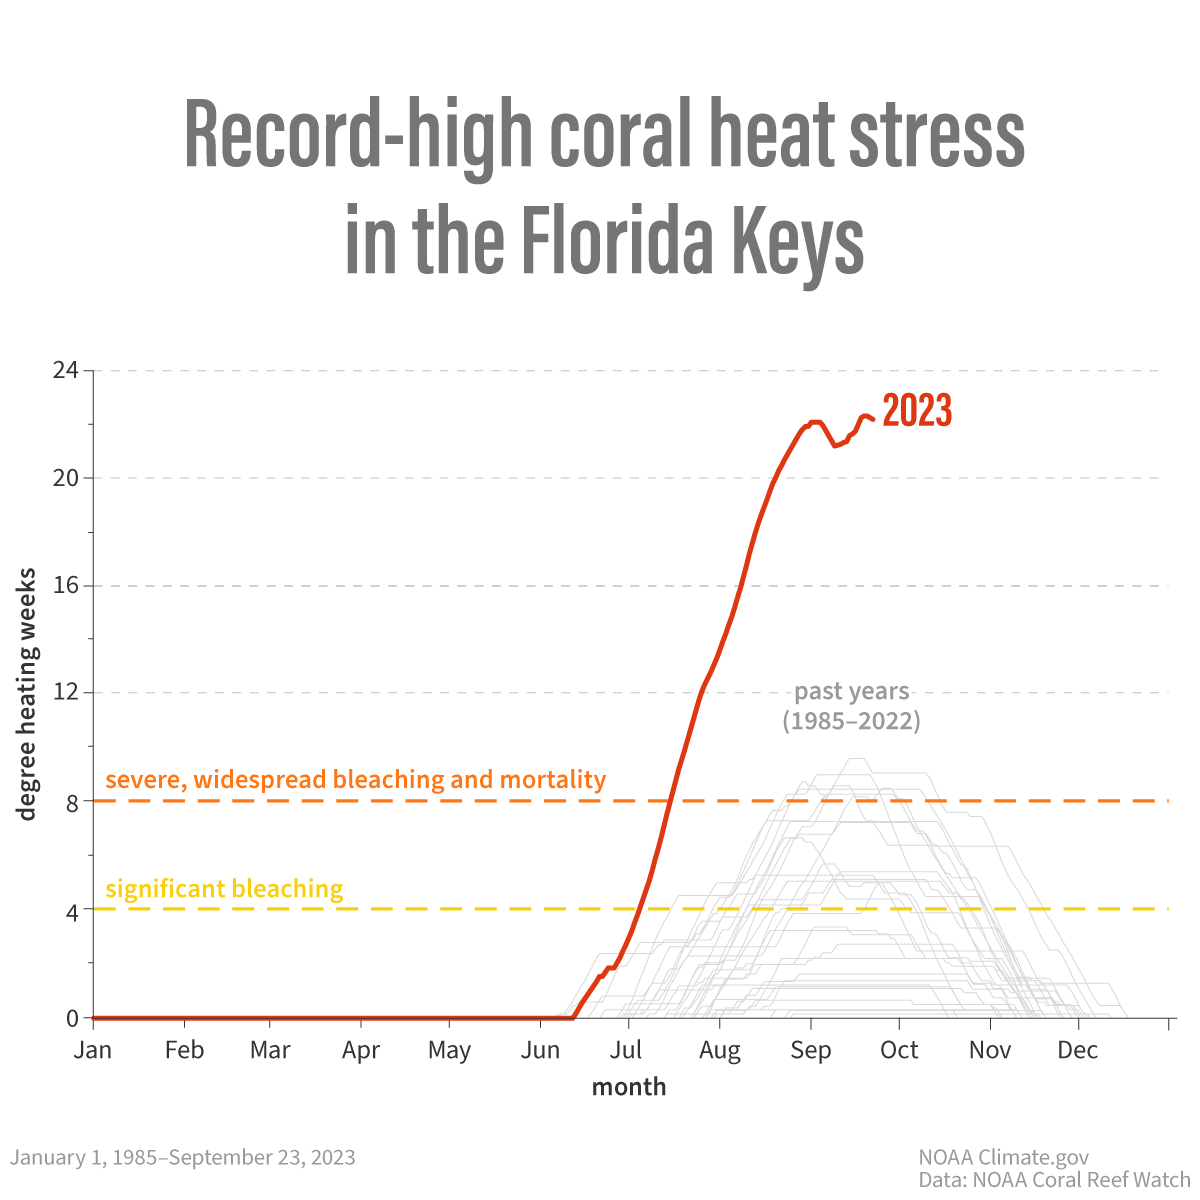
Florida's reefs have experienced unprecedented heat stress this summer. Beyond stopping global warming, what techniques can experts use to help save them? climate.gov/news-features/…
NOAA Climate.gov tweet mediaNOAA Climate.gov tweet media
English
4
44
81
28.6K
NOAA MAPP retweetledi
NOAA Climate.gov
NOAA Climate.gov@NOAAClimate·
According to an experimental forecast issued in June, 50% of the global oceans could experience heat wave conditions by September 2023. Without ocean warming, that predicted heat wave area would drop from 50% of the global ocean to 25%. climate.gov/news-features/…
GIF
English
4
66
123
14.5K
NOAA MAPP
NOAA MAPP@NOAA_MAPP·
A new MAPP-funded study works with state and tribal fishery managers to improve seasonal forecasts for West Coast Dungeness crab catch rate models. cpo.noaa.gov/News/News-Arti…
NOAA MAPP tweet media
English
0
0
0
156
NOAA MAPP
NOAA MAPP@NOAA_MAPP·
MAPP-funded research shows that the inclusion of zooplankton biomass in Earth Sysetm Models could improve the models' representation of ocean biogeochemistry. Read the study here: cpo.noaa.gov/News/News-Arti…
NOAA MAPP tweet media
English
0
0
1
144
NOAA MAPP
NOAA MAPP@NOAA_MAPP·
A new study, funded in part by MAPP and @DroughtGov has developed a high-resolution drought forecast model for the Western U.S. Watch the video below to learn more about this new #drought prediction model. 9news.com/video/news/loc…
English
0
0
0
118
NOAA MAPP
NOAA MAPP@NOAA_MAPP·
Rapid Sea Level Rise along the U.S. East and Gulf Coasts during 2010-2022 and Its Impact on Hurricane-Induced Storm Surge: cpo.noaa.gov/News/News-Arti…
NOAA MAPP tweet media
English
0
1
0
211
NOAA MAPP retweetledi
NOAA Climate.gov
NOAA Climate.gov@NOAAClimate·
Marine heatwave research has primarily focused on sea surface temperature extremes. While surface marine heatwaves can have dramatic impacts on marine ecosystems, new research shows how extreme warming along the seafloor can also have significant impacts. climate.gov/news-features/…
NOAA Climate.gov tweet media
English
5
45
73
15.2K
NOAA MAPP retweetledi
NOAA Climate.gov
NOAA Climate.gov@NOAAClimate·
Ever wonder about the climate models scientists use to forecast El Nino? The ENSO Blog is happy to introduce you to the North American Multi-Model Ensemble, or NMME. climate.gov/news-features/…
NOAA Climate.gov tweet media
English
2
64
148
18.4K
NOAA MAPP
NOAA MAPP@NOAA_MAPP·
North American Marine Heatwaves: How Do Sea Surface and Sea Floor Heat Waves Compare? A new MAPP-funded study looks at the difference between the sea surface and sea bottom marine heatwaves. cpo.noaa.gov/News/News-Arti…
NOAA MAPP tweet media
English
0
0
0
121
NOAA MAPP retweetledi
NOAA Climate.gov
NOAA Climate.gov@NOAAClimate·
In the thrall of a 22-year megadrought, the record snowpack in SW Colorado was a welcome break. When scientists installed a state-of-the-art observing network in the East River watershed in the fall of 2021, they couldn’t have imagined a year like this. climate.gov/news-features/…
NOAA Climate.gov tweet media
English
1
7
28
5.5K
NOAA MAPP
NOAA MAPP@NOAA_MAPP·
A new #ElNino model analysis advances key source of prediction skill: New model diagnostics promise to help improve models and predictions of U.S. seasonal to multi-year climate. cpo.noaa.gov/News/News-Arti…
NOAA MAPP tweet media
English
0
1
1
147
NOAA MAPP retweetledi
NIDIS Drought.gov
NIDIS Drought.gov@NOAADrought·
This graphic shows the difference in CA reservoir levels between Dec 1 and Jan 24. Shasta: from 57% historical avg to 86% Oroville: from 55% historical avg to 109%! Read a summary of recent CA/NV Climate and Drought Webinar for more info: drought.gov/webinars/calif… @NOAA @CA_DWR
NIDIS Drought.gov tweet media
English
0
40
96
16.3K
NOAA MAPP retweetledi
NOAA Climate.gov
NOAA Climate.gov@NOAAClimate·
A series of atmospheric rivers in Dec-Jan, fueled by tropical moisture, flooded parts of the West with rain and snow in January 2023. The abundant precipitation caused landslides and dangerous travel conditions, but also helped improve drought conditions. climate.gov/news-features/…
NOAA Climate.gov tweet media
English
3
21
62
23K
NOAA MAPP retweetledi
NOAA Climate.gov
NOAA Climate.gov@NOAAClimate·
The El Niño-Southern Oscillation (“ENSO” for short) can affect weather and climate extremes across the entire world impacting millions of people. But what about marine life? Learn about how ENSO also affects salmon across the North Pacific. climate.gov/news-features/…
NOAA Climate.gov tweet media
English
0
28
59
17.7K
NOAA MAPP retweetledi
NOAA Climate.gov
NOAA Climate.gov@NOAAClimate·
Interested in the frozen water part of Earth? Check out the Cryosphere Now page which provides recent plots, maps, images, and assessments that illustrate the current state of the cryosphere. toolkit.climate.gov/tool/cryospher…
NOAA Climate.gov tweet media
English
0
8
24
3.6K
NOAA MAPP retweetledi
USGS Landsat
USGS Landsat@USGSLandsat·
Decades of drought & a growing demand for water in the Colorado River Basin have brought Lake Mead to historic low water levels. Today, Landsat 9 shows the lake’s water level at 1,041—the lowest since the 1930s. eros.usgs.gov/media-gallery/…
English
2
11
14
0