
🐧
1.6K posts


@Pentosh1 😅 Slow ya roll, my good penguin…. 🐧 🛑
The Dino juice is not exactly “fungible” as you seem to imply. 🛢️ ⚖️ ⛽️
Very different “Real World Asset” tingz…. 😈
Michael McDonough@M_McDonough
🛢️There's a lot being said about oil prices right now, so I put this chart together to help explain the major crude benchmarks and why they're all behaving differently. ⚪Brent (white) — The world's "default" oil price. Most global trade is priced off this. When the news says "oil is at $108," they mean Brent. 🟡WTI (yellow) — The U.S. benchmark, based on crude delivered to Oklahoma. It's the lowest line on the chart because American oil doesn't need to transit the Strait of Hormuz. 🟢Murban (green) — Crude from Abu Dhabi, delivered at Fujairah port, which sits just outside the Strait. Even though it technically doesn't have to pass through the chokepoint, drone strikes have hit Fujairah and nearby ports, pushing insurance and shipping costs up. 🟣Oman (purple) — The key benchmark for heavier crude sold into Asia. Many refineries in China, Japan, and South Korea are built specifically to process this grade. It's the highest line on the chart because Asian buyers are competing fiercely for a shrinking pool of cargoes. 🔴Dubai (red) — Used to price most long-term Gulf→Asia export contracts. It tracks alongside Oman as a measure of how hard Asian markets are being squeezed. The story isn't any single price — it's the gap between them. In late February these five lines were within $6 of each other. Now the spread between WTI and Oman is over $50. Since the U.S.-Israeli strikes on Iran began Feb 28, the Strait of Hormuz has effectively been closed. Daily transits have fallen from a historical average of ~138 ships to fewer than 5. The IEA has called it the largest disruption to global energy supply in history. Iran's IRGC has warned that not "a litre of oil" will pass for U.S. allies, while selectively allowing some Iranian, Indian, and Pakistani tankers through. Saudi Arabia is rerouting oil to its Red Sea port at Yanbu, and the UAE is using a pipeline to Fujairah — but combined pipeline capacity is only 3.5–5.5 million barrels/day vs the 20 million that normally flows through the Strait. Meanwhile, the 400 million barrel emergency reserve release by IEA members covers roughly 4 days of global consumption. Japan's refiners get ~95% of their crude from the Gulf. China receives 45% of its oil via Hormuz. South Korea, India, Thailand, Pakistan, and Bangladesh are all severely exposed. The wider the spread between the Asian benchmarks and Western ones on this chart, the more you're seeing that pain in real time.
English


@blknoiz06 Hockey honestly the best sport in the world
The skill of some of these players and toughness is something else.
English


@Pentosh1 I agree Pentoshi, but don’t you think we should also assess the scenario that should they ran out of steam the free fall
will be massive?
English
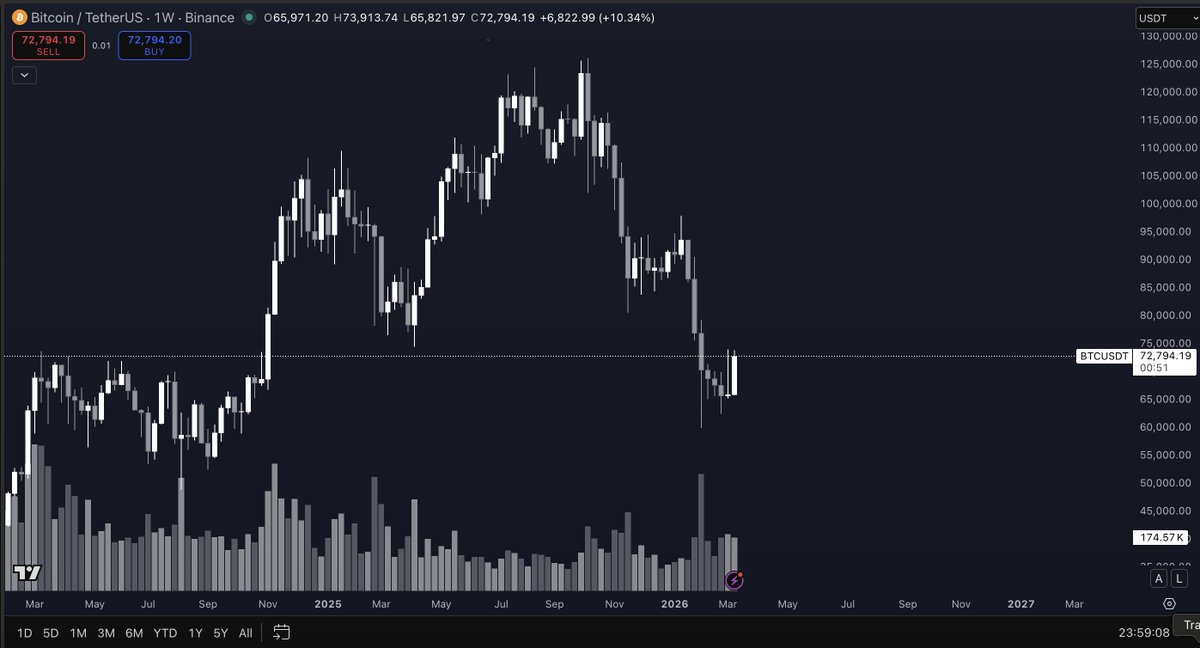
locally $BTC keeps knocking at this resistance, with less time between each tap, and higher lows starting on low time frames grinding out shorts and applying pressure. nice bullish momentum forming

🐧@Pentosh1
Looking pretty good there on that $BTC weekly close. This continues to remain true. 74-80k in this next week very likely.
English


Looking pretty good there on that $BTC weekly close.
This continues to remain true.
74-80k in this next week very likely.
🐧@Pentosh1
Feel like, $BTC has had a number of opportunities to go down the past couple weeks and hasn't. When it stops reacting to news good or bad, you typically end up with a move in the opposite direction more often than not
English


@Pentosh1 the ex-dividend date is tomorrow so it makes sense that today would be the biggest inbound for STRC. the real question is what happens tomorrow
English

@Pentosh1 Do you know how to calculate an average?
English
Somehow next week he’ll tweet an average cost basis of a price we never traded at
🐧@Pentosh1
2000 $BTC already for Saylor today. A record setting day inbound for STRC. I dont know how long he can sustain this pace, but any meaningful time will likely have a very large impact for $STRC. fun to watch and track strc.live
English

