andrii

118 posts

andrii banner
andrii

andrii

@anrew_bart

Lviv, Ukraine🇺🇦 Katılım Eylül 2016
91 Takip Edilen34 Takipçiler
andrii
andrii@anrew_bart·
@ProbableChris btw do you use any oscillators? I saw on some of your videos some grey background with 1 or 2 lines. is this MACD lines or moving averages?
English
0
0
0
65
Chris™
Chris™@ProbableChris·
Solid +2r on the AM TBR this morning. Will see what the rest of the New York morning presents, but 2r before market open, on a Monday..... just going to be patient.
Chris™ tweet media
English
9
1
75
3.4K
andrii
andrii@anrew_bart·
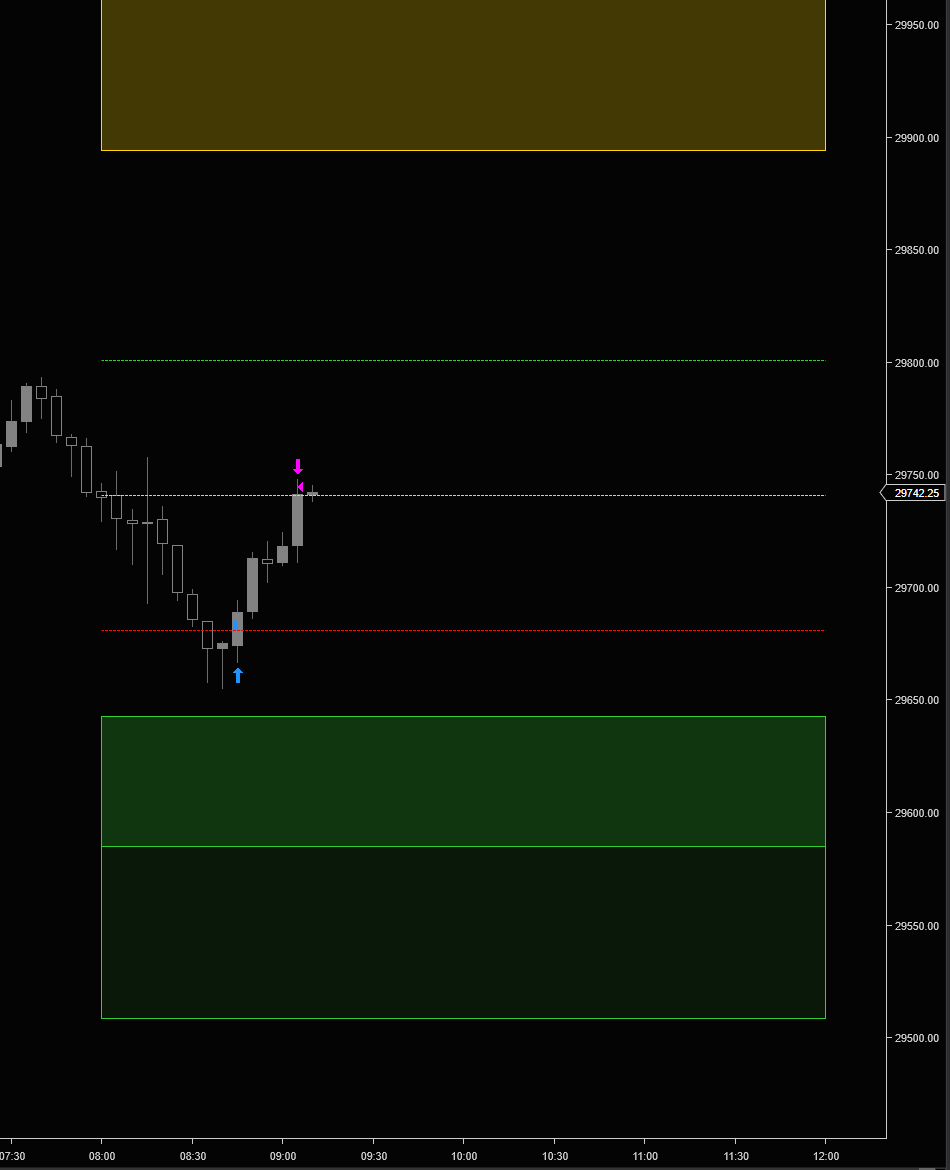
@ProbableChris Nice. I'm BE today, 1 loss, 1 win. 09:59 and 10:48 longs, target was 8am open for both.
English
0
0
1
75
andrii
andrii@anrew_bart·
@ProbableChris What your triggers to enter trades. Not only in AM TBR trade, but others IB, noon curve etc. Asking how to no get swept and then rage when price go in right direction.
English
1
0
2
118
Chris™
Chris™@ProbableChris·
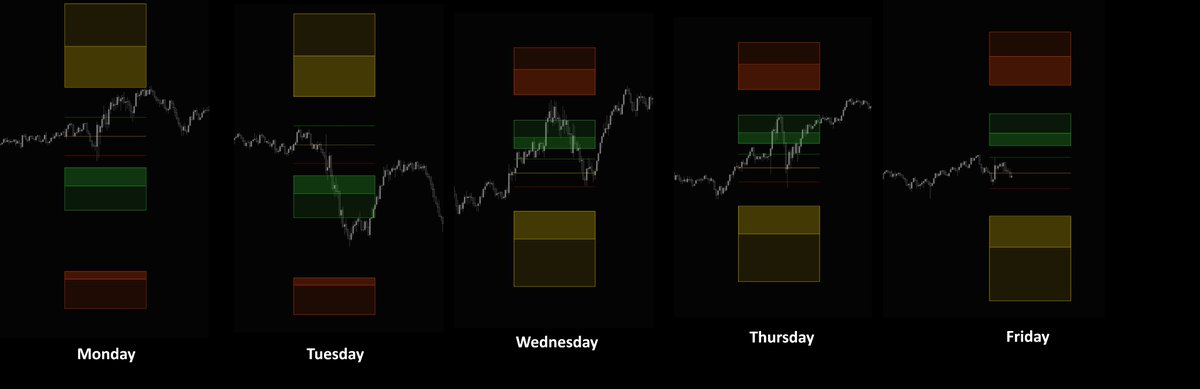
What did the "AM TBR" data look like this week? Monday, gave a clean -0.25 tap and bounce back to TBR Open. Did not dig much into the MAE, so entering on these feels a bit "front running", but the push higher took it to MFE. Tuesday, +0.25 came close but wasnt tagged, -0.25 ended up getting tagged and diving beyond the 95th percentile and stalling there until TBR close. Wednesday, nice push into +0.25 and up into the high percentile of reverted MAE, than a retrace to TBR Open. Thursday, push into +0.25 and ug into the 95th percentile of reverted MAE, formed a clean pivot and retraced to TBR open. Friday, very quick tap of +0.25 and retrace to TBR open leaving no room really for any viable entry, and an entry would of been front running the expected MAE. ------------- Many variations of how someone could of leveraged this data, and from a statistical hit rate perspective, it was 80%. Thursdays setup was the only one I traded, the only one that was clean enough for a trade. Wednesday could of potentially worked too, just seemed choppy at the top.
Chris™ tweet media
Chris™@ProbableChris

New module added to NQ Stats "AM TBR" - nqstats.com/am_tbr.html Have been meaning to get this added to the site, just haven't had time. This is time based range data I use pretty much every day as a confluence/filter for trades taken typically before NY open. The idea is simple, collect a rolling 20-day price distribution of the 8am-12pm time based range. If you aren't familiar with price distributions, check out that section on the site. This rolling distro is used to get the +/- 0.25 sdev values, which are the trigger points. Which ever is hit first, either the + or - 0.25, this creates the expectation of reversion back to the TBR Open (8am open). The site provides total reversion metrics and by-the-hour metrics. I specifically focus on reversions within the first hour (8am hour), as that has the highest hit rate. MAE for reverted and non-reverted events is provided, as well as the MFE beyond the TBR Open, derived from 10yrs of data. You will find various other data pieces on the site, but here is what it looks like on a chart. Video coming soon....


English
5
0
55
6.3K
andrii retweetledi
gemchanger
gemchanger@gemchange_ltd·
The scariest moment in algo trading is finding out your strategy works on random data too. neurotrader video shows the kill switch: "How I Develop Trading Strategies | Permutation Tests and Trading Strategy Development with Python." 21 minutes of pure framework. I wrote a companion deep-dive that takes this Monte Carlo foundation Extending it across every simulation method quant firms actually use From particle filters updating in real time on election night To copula models capturing tail dependence across correlated markets. Start with his video. Go deeper with the article.
gemchanger@gemchange_ltd

x.com/i/article/2027…

English
63
248
2.9K
476.5K
andrii retweetledi
Jester
Jester@jestertrading33·
In this video I do some advanced analysis on the failed gap fill (powerful stuff) and I give some detailed analysis on the long trade I took earlier. This one might have some golden nuggets in it so I recommend watching the entire thing when you get a chance.
English
3
8
177
8K
andrii retweetledi
Will Hu
Will Hu@traderwillhu·
Top Performers in US Stock Market since 2000 I want to share a self-hosted stock research tool that identifies and visualizes the most powerful price moves in US equity market from 2000 to current date. It processes raw daily OHLCV data for over 12,000 US tickers — including delisted stocks — and surfaces the top 7% performers each year for in-depth chart study. Github link: github.com/willhjw/big_mo… The project is inspired by the trading methodology of Kristjan Kullamägi (Qullamaggie), which focuses on learning from stocks that made exceptional gains in a short period of time. By studying these historical moves in detail — their price structure, volume behavior, and timing — traders can develop a sharper eye for recognizing similar setups as they form in real time. This is also a use case for my open-source charting platform. github.com/willhjw/ib_cha… If you find this project helpful, welcome to buy me a coffee. buymeacoffee.com/willhu Disclaimer Stock data and any statistics or charts derived from it are not guaranteed to be 100% accurate or complete. You are responsible for independently verifying the accuracy and suitability of the data before using it for any purpose.
Will Hu@traderwillhu

Thanks to AI coding, a complex learning process is now much simpler. I filtered the top 7% YTD stocks from 2000–2026 (including delisted ones), get 1400+ stocks, and visualized them with TradingView Lightweight Charts, featuring auto-marked highs/lows and direct period displays. Browse by year or symbol, even delisted stocks from the last decade like $LVGO and $TWTR are fully accessible. Once I refine the charting and annotation features, I will open-source this learning project.


English
20
84
492
77.7K
andrii retweetledi
Magus
Magus@TraderMagus·
TPO Settings Quick thread covering how to setup your TPO -TPO -Daily Delta -Visible Range
Magus tweet media
English
8
44
345
21.3K
andrii
andrii@anrew_bart·
@SmallCapSmarts Hey, can you recommend any sources where to start learn to do proper backtesting, coding? As person who never dig or learn that I want to dive deep.
English
0
0
0
1
small_caps_automated
small_caps_automated@SmallCapSmarts·
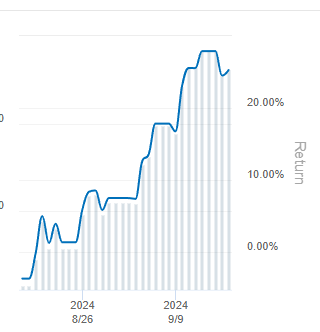
After 2 weeks of running bots while traveling, I honestly have no idea what I’m doing all day at the desk. Good discretionary trades are rare, and watching P&L just adds stress. I checked my large-cap/options account maybe twice during the whole vacation:
small_caps_automated tweet media
English
10
0
110
14.8K
andrii
andrii@anrew_bart·
@ProbableChris Hey, can you please recommend some videos on how to do proper backtesting on large data samples as you doing it ,tools as well. I want to dive deep as a person who never dig that deep.
English
1
0
0
94
andrii retweetledi
Luc
Luc@investingluc·
here is the prompt I used on @perplexity_ai max (Computer)...feel free to mess around with the weightings, etc. ----------------------- PROMPT: Build “Should I Be Trading?” — Bloomberg Terminal-Style Market Dashboard Build a live, auto-refreshing Bloomberg Terminal-style web dashboard called “Should I Be Trading?” that evaluates the current stock market environment and outputs a clear, actionable trading decision for swing traders. --- Core Output The system must display: 1. Decision: YES / CAUTION / NO 2. Market Quality Score: 0–100% 3. Execution Window Score: 0–100% (separate) 4. Plain-English Summary: concise explanation of the environment --- Data Inputs (Live or Latest Available) Volatility / Risk - VIX level, trend (5d slope), and 1-year percentile - VVIX (if available) - Put/Call ratio (estimate if needed from VIX regime) Trend & Structure - S&P 500 (SPY) vs 20 / 50 / 200-day moving averages - QQQ vs 50-day moving average - SPY 14-day RSI - Market regime classification: uptrend / downtrend / chop Breadth - % of stocks above 20d / 50d / 200d moving averages - NYSE Advance/Decline line + daily ratio - Nasdaq new highs vs new lows - McClellan Oscillator (optional if available) Momentum / Participation - All 11 S&P sector ETFs: XLK, XLF, XLE, XLV, XLI, XLY, XLP, XLU, XLB, XLRE, XLC - Top 3 vs bottom 3 sector performance (relative strength spread) - % of stocks making higher highs Macro / Liquidity - 10-Year Treasury yield (level + short-term trend) - Dollar Index (DXY trend) - Fed stance (derived or labeled: hawkish / neutral / dovish) - FOMC calendar (flag if event within 72 hours or same day) - Optional: CPI / Jobs flags --- Scoring System Calculate category scores (0–100): - Volatility: 25% - Momentum: 25% - Trend: 20% - Breadth: 20% - Macro/Liquidity: 10% Then compute: Market Quality Score = weighted average --- Decision Logic - 80–100 → YES Full position sizing, press risk - 60–79 → CAUTION Half size, A+ setups only - <60 → NO Avoid trading, preserve capital --- Execution Window Score (Critical Layer) Separate score that evaluates whether setups are actually working: - Are breakouts holding above pivot levels? - Are leading stocks maintaining gains after breakout? - Are pullbacks being bought quickly? - Is there multi-day follow-through? Score 0–100 and factor into final explanation (but NOT the main score weighting). --- UI / UX Requirements (Bloomberg Terminal Style) Visual Style - Dark blue/black background - Monospace font - Green / red / amber indicators - Minimal, dense, high-signal layout --- Layout Top Bar - Scrolling ticker (SPY, QQQ, VIX, DXY, TNX, sectors) - Status indicator: LIVE / UPDATING - Last updated timestamp (“updated 12s ago”) - Manual refresh button --- Hero Panel - Large “Should I Trade?” decision badge (YES / CAUTION / NO) - Circular score visualization (0–100%) - Subtext: “Market Quality Score” --- Core Panels (Grid) Each panel includes: - Current value - Direction (↑ ↓ →) - Interpretation (healthy / weakening / risk-off) Panels: 1. Volatility 2. Trend 3. Breadth 4. Momentum 5. Macro --- Sector Heatmap - Horizontal bar visualization of 11 sector ETFs - Highlight leaders vs laggards --- Scoring Breakdown Panel - Show weight + score per category - Visual contribution to total score --- Alert Banner - Display when FOMC / CPI / major macro event is imminent --- Terminal Analysis (AI Layer) Generate a short explanation like: “This is a strong trend environment with expanding breadth and moderate volatility. Sector leadership is concentrated in technology and industrials. Favor selective swing trades with disciplined risk.” --- Mode Toggle - Swing Trading Mode - Day Trading Mode (adjust thresholds slightly tighter and faster) --- Technical Requirements - Auto-refresh every 45 seconds - Server-side cache (30 seconds) to reduce API load - Loading skeleton states while fetching - Error handling for missing data - Modular architecture (easy to swap APIs) --- Output Requirements Return: 1. Full frontend layout (React preferred, Tailwind optional) 2. Backend/data aggregation logic (Node or Python) 3. Clear scoring formulas (editable) 4. Example output using current/latest market data 5. API recommendations (free + paid) --- Success Criteria - Clean, fast, high-signal UI - Accurate regime detection - Simple, trustworthy YES / NO output - Feels like a personal risk manager, not just a data dashboard ♥️Luc
English
46
67
837
35.9K
andrii retweetledi
Will Hu
Will Hu@traderwillhu·
My Top 5 Free APIs and Libraries for Stock Screening & Trading Dashboards Many people have been asking about the specific APIs and libraries I use to build my stock screening tools and trading dashboards. After extensive testing, I’ve narrowed it down to a few reliable tools. Here is a breakdown of my current tech stack based on my personal experience. 1. TradingView Screener (Unofficial Library) For my Pre-market Gappers scan, I rely on a TradingView screener library. While this isn't an official API, it provides scanning results and criteria identical to the TradingView desktop software. GitHub: github.com/shner-elmo/Tra… Pros: Highly accurate; matches TradingView’s powerful UI filters. Cons: There is a 15-minute data delay. Unless you require sub-second real-time scanning, this is usually negligible for swing trading or early-day prep. 2. Finviz Finance Library I primarily use this to scrape news and market sentiment. It’s excellent for aggregating headlines and URLs directly from Finviz. GitHub: github.com/lit26/finvizfi… Use Case: Automatically fetching the latest news for specific tickers to understand the "catalyst" behind a price move. 3. TradingView Lightweight Charts & Tradingview Widgets This is my go-to for technical analysis visualization. GitHub: github.com/tradingview/li… Chart Widgets: tradingview.com/widget-docs/wi… The Difference: Lightweight Charts: Best for building custom tools. It’s high-performance and allows you to program any custom indicator you can imagine. Chart Widget: If you want a "plug-and-play" experience, this is easier but comes with a 15-minute delay and limits you to native indicators (no custom Pine Script/logic integration). 4. Brokerage APIs: Charles Schwab vs. IBKR I have integrated both, and here is how they compare: Charles Schwab API: Completely free. The only "catch" is that you need to manually refresh your tokens weekly. IBKR API: While the API is free, real-time data usually costs $1–$2/month. It also requires you to have TWS (Trader Workstation) or IB Gateway running in the background. My Verdict: I prefer Schwab for daily use. It’s more "lightweight" as long as you remember to update your tokens over the weekend. 5. Apache ECharts ECharts is the "all-rounder" of data visualization. I use it to complement TradingView’s charts. Official Website: echarts.apache.org Use Case: While TradingView is more professional for price action, ECharts is superior for Post-Trade Analysis in my trading journal. The interactivity and ability to visualize complex equity curves or win-rate distributions are top-tier. ------ Of course, there are plenty of superior paid resources out there. However, if you’re a trader just getting started with vibe coding, these free tools are perfect for getting your hands dirty and sharpening your skills first. Feel free to share more in the comments!
English
21
119
779
68.4K
andrii retweetledi
Jeff Sun, CFTe
Jeff Sun, CFTe@jfsrev·
Video Walkthrough of My Daily Process: How I merge my Finviz screener, TradingView watchlists, and a 'Compression' screener to generate stalk & focused ideas. Here’s a quick walkthrough of how I generate my stalk/focused ideas—also shared exclusively with my X subscribers through a daily pre-market tweet condensed into a 5-minute reference. A breakdown of the process; 1. Tradingview as my based charting and watchlist management platform. It is tile next to my finviz web browser. 2. I have 13 preset screeners across both platforms , 9 in finviz (post-market to watchlist), 4 in tradingview (watchlist compression, pre-market gapper of stock & etf, watchlist RVOL sorted). Details of each screener are shared in Chapter 3 of jfsrev.substack.com/my-trading-too…. You can also get direct Shared Screen access from x.com/jfsrev/status/… 3. I copy each screened result from Finviz and paste it into its corresponding TradingView watchlist (e.g., “Hottest Stock” results go into the “Hottest Stock” watchlist). @erikcarell has built a Finviz API workaround that lets you import an entire screen directly into a TradingView watchlist. x.com/erikcarell/sta… 4. Screened results aren’t usually actionable on their own, so I add an extra layer— “compression” screener within TradingView—and run it through each dedicated watchlist. This is what I refer to as a “screen within a screen.” My watchlists are color-coded to show which screener each stock came from—and to highlight when a name appears across multiple screeners (e.g.,🔴= Hottest Stock). 5. I review each name that passes the “compression” screener, evaluating them one by one on the chart to determine whether they qualify for my stalk/focused idea watchlist. The criteria I use are outlined in my “15 Hard Rules” in Chapter 6. jfsrev.substack.com/my-trading-too…. 6. The same process is then applied at the ETF level, since TradingView separates its Stock and ETF screeners into two different sections. 7. On top of that, I manually review over 160 ETFs to track day-by-day price action/RS across industry groups (not shown in the video). The full workflow—including post-market study—takes at least 2 hours per session. The process flows as follows: Screening → Watchlist Management → Focus List Rebuild & Preparation → Qualitative Market Reading for Situational Awareness → Portfolio Stop Management (when needed). No single screener will ever capture every opportunity. To stay ahead of the market, you need unwavering dedication, discipline, and consistency. Eventually, the market rewards that effort with the strong, or trending moves. But first, you need a strategy and process that fits your lifestyle and is sustainable over the long term. I hope you all find this helpful as we navigate this challenging yet financially rewarding journey.
Erik Carell@erikcarell

A simple version, copy paste functionality, is now public code. I tried to be as explicit as possible in the README to make it easy for anyone to set up on their own. gitlab.com/erikcarell/fin… @jfsrev

English
17
138
845
370.9K
andrii retweetledi
Vinod
Vinod@BoxTraderVK·
Extreme Hard work and FOCUS I studied Qullamaggie, Druckenmiller, Paul Tudor Jones & Stockbee for hundreds of hours, tested every system on real charts, and turned it into 17 complete long-form Articles. No gatekeeping. No paywall. Pure alpha that leveled me up. 1. How to Draw, Confirm & Trade Trendlines the Right Way — x.com/i/article/2033… 2. The Multi-Timeframe System That Turned $5k Into $100M — x.com/i/article/2033… 3. Smart Money Pre-Market Scanner: Finding Explosive Moves — x.com/i/article/2032… 4. Pradeep Bonde (Stockbee) Complete Momentum Trading Playbook — x.com/i/article/2030… 5. What It Really Takes to Go ALL IN Like Druck or KQ — x.com/i/article/2030… 6. The Daily Trading Routine & Process of Professional Traders — x.com/i/article/2030… 7. Paul Tudor Jones Complete Trading Playbook — x.com/i/article/2029… 8. Stanley Druckenmiller Trading Playbook (30 Years, Zero Losing Years) — x.com/i/article/2029… 9. Kristjan Qullamägi Trend Trading System (Stocks Move Like Stairs) — x.com/i/article/2028… 10. All Flag Pattern Variations – The Complete Qullamaggie Playbook — x.com/i/article/2027… 11. 12 Trading Mistakes That Quietly Kill Your P&L (Qullamaggie) — x.com/i/article/2026… 12. Qullamägi Mean Reversion Playbook: Parabolic Shorts & Bounces — x.com/i/article/2026… 13. Why the Best Breakouts Happen Exactly at the 10/20 Day MA — x.com/i/article/2025… 14. 8 Rules to Trade Without Anxiety & Emotional Control — x.com/i/article/2025… 15. You Cannot Borrow Conviction – Qullamaggie’s Most Important Lesson — x.com/i/article/2024… 16. Why 25% Win Rate Made Qullamaggie $100 Million — x.com/i/article/2024… 17. How Qullamaggie Uses VWAP for Parabolic Shorts — x.com/i/article/2023… Which one are you starting TONIGHT? Me, i will go through everyone of them.
English
38
183
939
81.3K
andrii
andrii@anrew_bart·
@ar0fx nice, what was the context of trade?
English
1
0
0
83
andrii retweetledi
Jeff Sun, CFTe
Jeff Sun, CFTe@jfsrev·
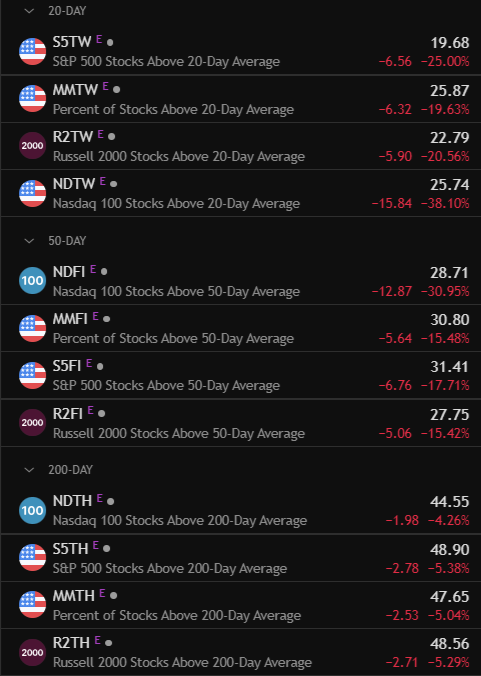
Useful Symbols for a quick bird’s-eye view on your Tradingview watchlist panel. Almost all of them are approaching 6-month low level. One more round of capitulation would likely set up some very attractive long-bias opportunities for quick bounces.
Jeff Sun, CFTe tweet media
Jeff Sun, CFTe@jfsrev

This is my free EOD breadth level panel on @tradingview — you can use the same ticker to build your own, there are much more options but I always have mine based on traditional MA value. Breadth absolutely deserves a place in your trading system, and I couldn’t agree more. When used right, it’s incredibly powerful — especially when you combine with a thorough screen of sectors and industry groups showing relative strength. One important nuance I want to highlight: relative strength isn't just about securities outperforming the benchmark on the surface. It also emerges from names that show the least weakness during prolonged down moves. That resilience matters, and that itself will be a upturning RS on a line chart based indicator. To consistently spot these opportunities, routine is everything. Regardless of what the market throws at you, your process has to stay intact — it’s what anchors your emotional discipline. Don't shut off yourself from market because of capitulation days, you should actually put even more time to mutiple screening to sieve out names for your watchlist. P.S. If the market gives us one more round of capitulation, I’m genuinely excited about the potential long bias setups that could follow. ES Futures at asia open now has already gapped down but with potential doji star to close (indecision candle), and reduced volatility going forward can build the second bear flag for April.

English
11
51
388
56.1K
andrii
andrii@anrew_bart·
@lmtbuy what was the context? I'm looking at that are and don't see why would I enter there
English
0
0
1
34
9
9@lmtbuy·
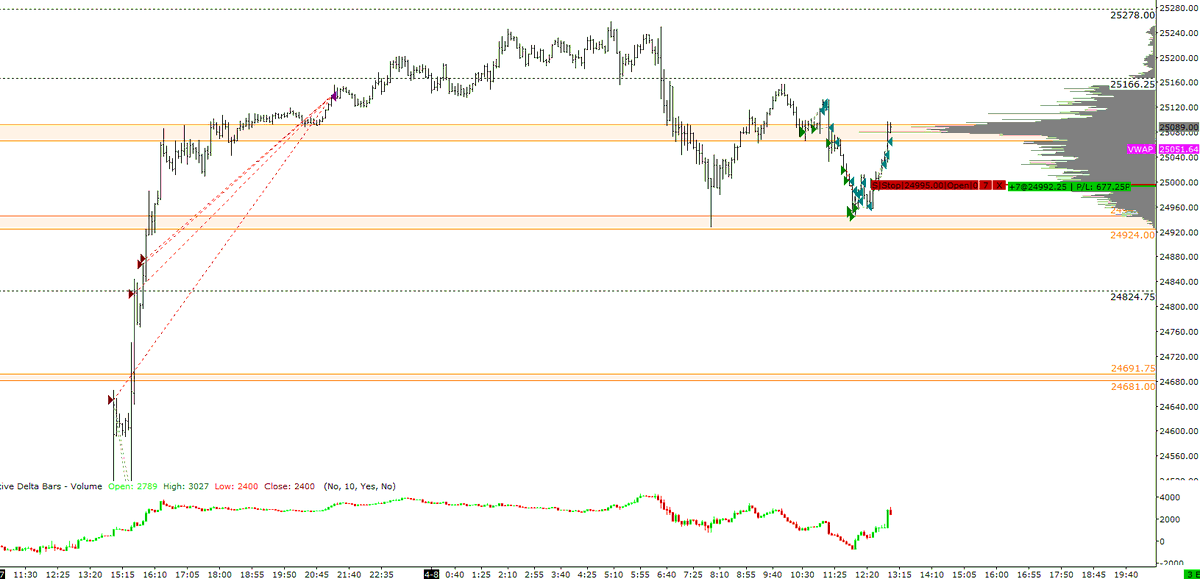
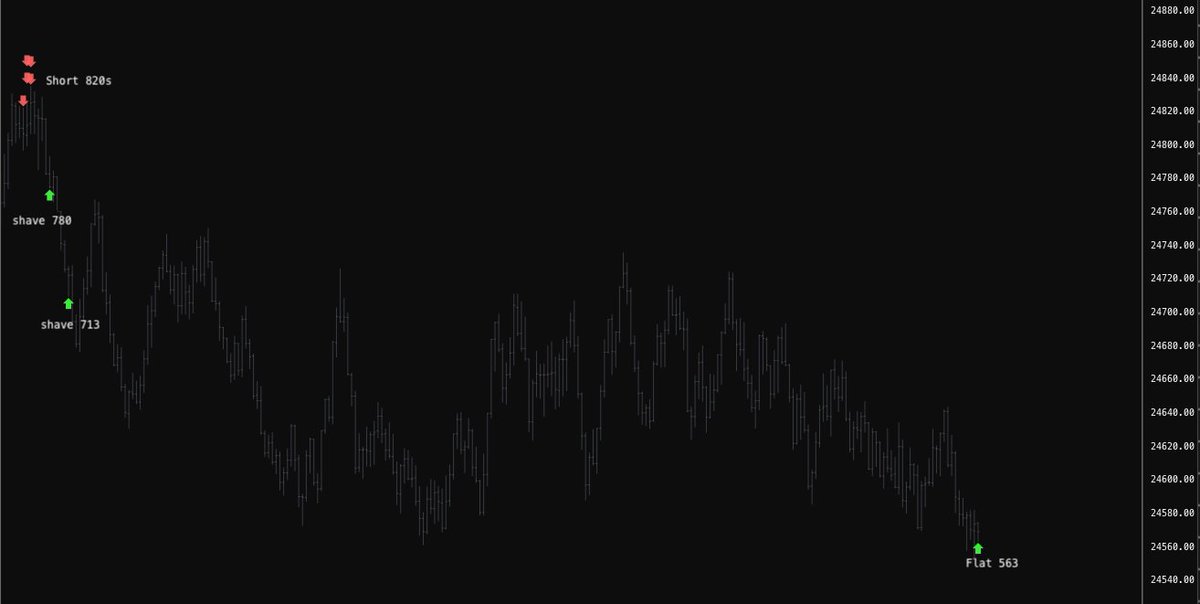
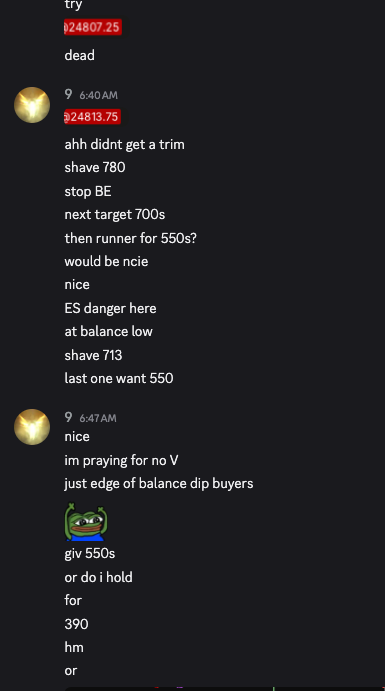
$NQ_F Calm day (+400pts) ate 1 stop, managed to get some size on it as well.
9 tweet media9 tweet media
English
3
1
25
2.1K