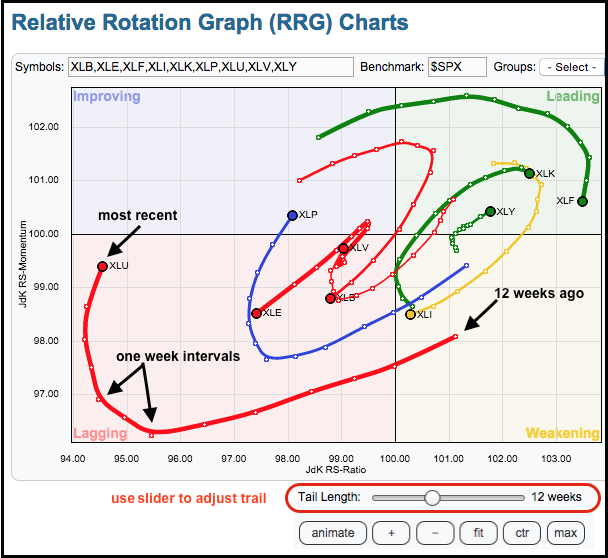
Julius de Kempenaer | RRG®

8.6K posts

Julius de Kempenaer | RRG® banner
Julius de Kempenaer | RRG®

Julius de Kempenaer | RRG®

@RRGresearch

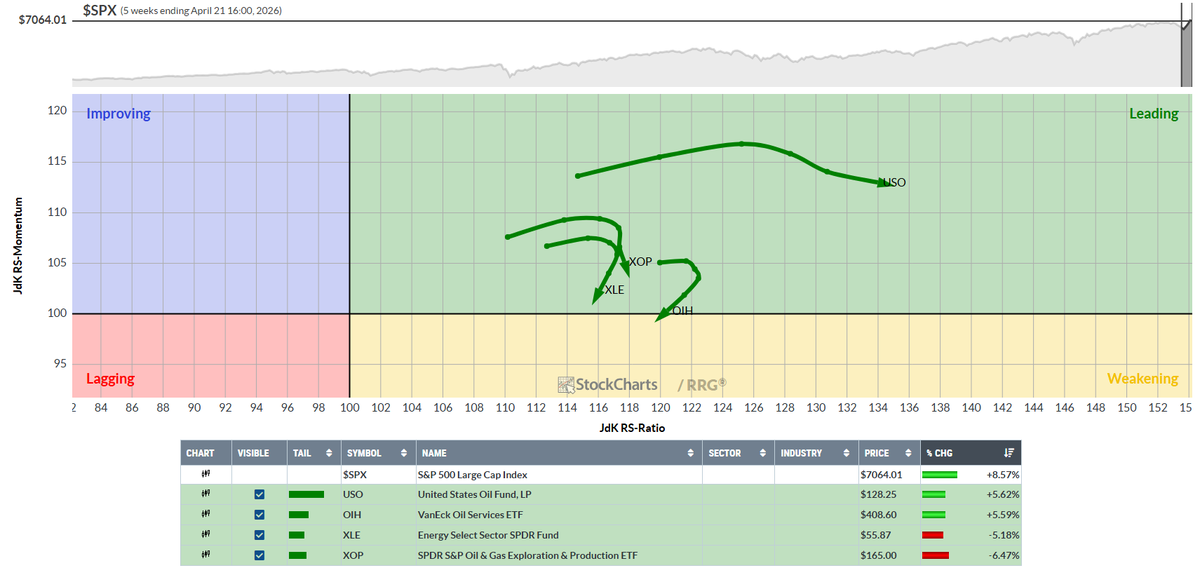
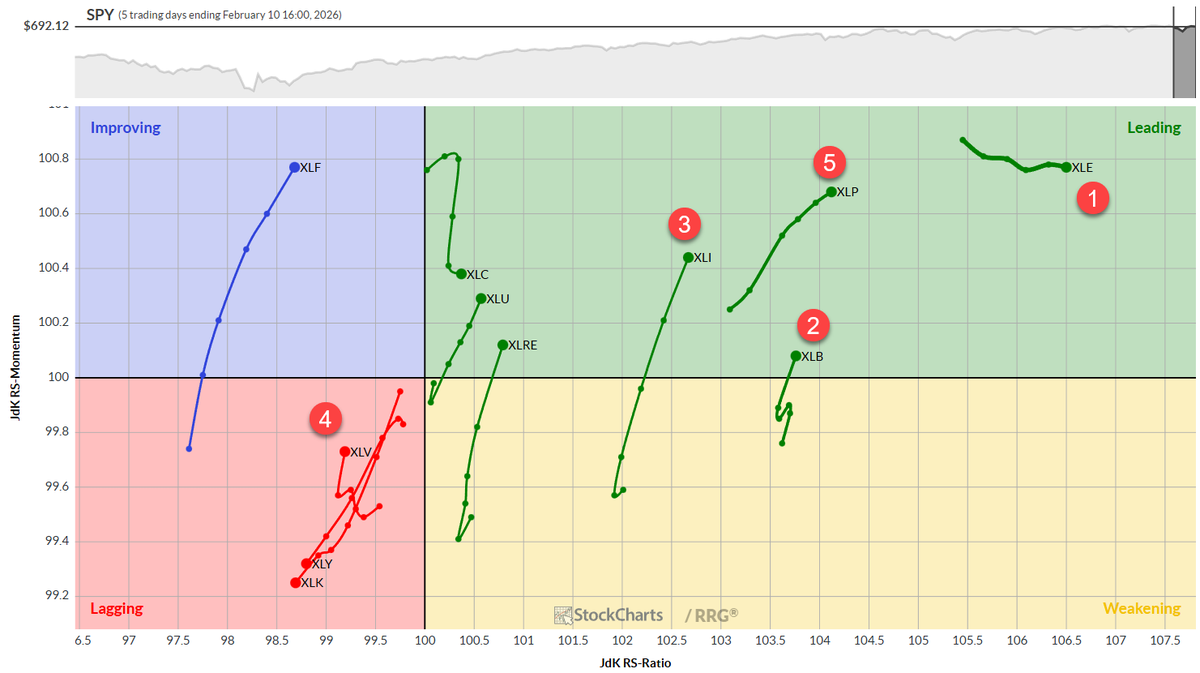
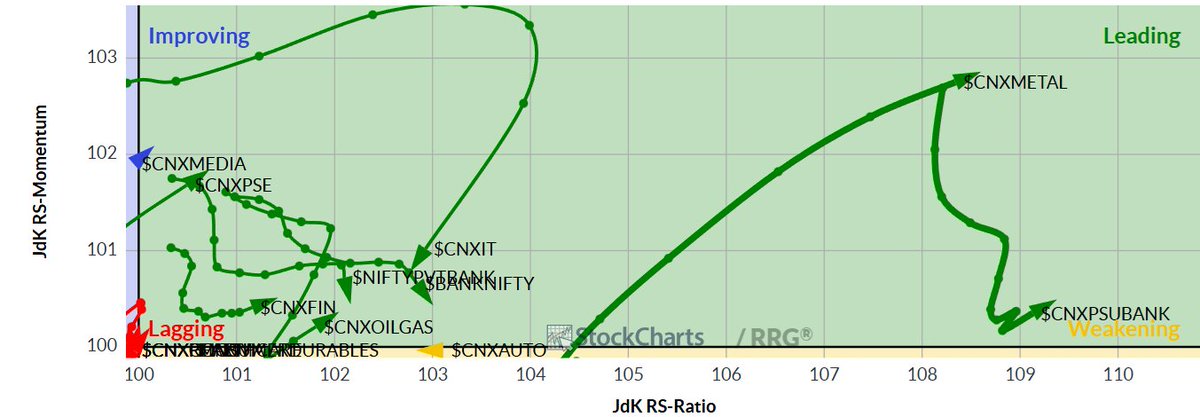
Relative Rotation Graphs® are a unique way to visualize relative strength and sector rotation in financial markets.

Amsterdam Katılım Temmuz 2011
855 Takip Edilen9.1K Takipçiler
Julius de Kempenaer | RRG®
Julius de Kempenaer | RRG®@RRGresearch·
That's an interesting rotation but a tough call. Given the high correlation of these 4 symbols I am inclined to say that USO will have to get back in-line with the others. On the other hand USO usually is the leading symbol and the others will follow. Based on the very high readings on the RS-Ratio scale I would go for a scenario where USO rolls over, which will confirm/support the loss of momentum in the other three. They all rotate through weakening and then come back up to leading. Initial weakness followed by a renewed rally
English
0
0
2
207
Phatinfantry Trading
Phatinfantry Trading@Phatinfantry·
$USO on the Relative Rotation Graph (RRG) with very unusual RS by USO (for obvious reasons). Looking back 10 years this type of distance between USO and $XOP $XLE $OIH has never been greater in the leading quadrant... Slingshot back to agreement or does USO break? @RRGresearch
Phatinfantry Trading tweet media
English
1
0
2
697
Julius de Kempenaer | RRG® retweetledi
StockCharts.com
StockCharts.com@StockCharts·
🚨 Top Sectors of the Week from @RRGresearch 🚨 1️⃣ Energy - XLE [15%] 2️⃣ Materials - XLB [10%] 3️⃣ Industrials - XLI [40%] 4️⃣ Utilities - XLU [10%] 5️⃣ Consumer Staples - XLP [25%] Read more: schrts.co/nfEwxwIb
English
1
2
10
997
Brian Shannon, CMT
Brian Shannon, CMT@alphatrends·
Trump, Bibi, Hegseth's 'everything's going great' reassurances on the war feel exactly like a CEO hyping the stock in a downtrend. Triggers knee jerk buying ➡️ shorts cover ➡️ big players sell into the rip ➡️ another lower high, lower low as the downtrend (below decl 20 and 50sma) continues. Same bearish pattern playing out
English
28
37
394
29.4K
Julius de Kempenaer | RRG® retweetledi
StockCharts.com
StockCharts.com@StockCharts·
@RRGresearch The leading quadrant continues to be dominated by long RRG tails for Energy, Materials, Industrials, and Consumer Staples. Read the full breakdown: schrts.co/vCiyrPES
English
0
2
13
1.2K
Julius de Kempenaer | RRG®
Julius de Kempenaer | RRG®@RRGresearch·
> Energy remains the top sector, with materials ($XLB) and industrials ($XLI) following; consumer staples ($XLP) moved up, healthcare ($XLV) slipped, and real estate ($XLRE) made a notable jump. > Weekly and daily #RRGchart analysis shows energy ($XLE), materials ($XLB), and industrials ($XLI) leading with strong momentum. > Heavyweight sectors technology ($XLK), consumer discretionary ($XLY), and financials ($XLF) are underperforming and causing a drag on $SPY. #SectorRotation #AssetManagement #Trading bit.ly/40cOu90
Julius de Kempenaer | RRG® tweet media
English
0
0
11
729
Julius de Kempenaer | RRG®
Julius de Kempenaer | RRG®@RRGresearch·
The Leaderboard Shake-up Big shifts in sector leadership this week! 📉 Technology ($XLK)andCommunicationServices($XLC) have dropped out of the top 5 for the first time in a long while. Energy ($XLE) has taken the lead, surging to the #1 spot and breaking out to new all-time highs. articles.stockcharts.com/article/the-be…
Julius de Kempenaer | RRG® tweet mediaJulius de Kempenaer | RRG® tweet media
English
0
0
9
615
Wealocity Analytics
Wealocity Analytics@brahmachary·
#RRGresearch Charts show that the Nifty IT, Nifty50, and Banknifty indices are losing relative momentum rapidly, despite being in the leading quadrant. @RRGresearch
Wealocity Analytics tweet media
English
2
1
31
3.4K
Julius de Kempenaer | RRG® retweetledi
StockCharts.com
StockCharts.com@StockCharts·
🏈 The Fantasy Stock Draft is BACK. 📈 @TomBowley & @RRGresearch are on deck first, engaging in a little back-and-forth before they step onto the field. Who do you think will win this face-off? Register for FREE: bit.ly/4rnCKMj
English
0
1
6
1.6K
Julius de Kempenaer | RRG®
Julius de Kempenaer | RRG®@RRGresearch·
@Mkts_Compass @Optuma This totally confirms that US listed (quoted in USD) ETFs tracking foreign markets should not be used to do "technical analysis" on that stockmarket ;) Use the underlying stockmarket index (in local currency) instead.
English
0
0
0
22
The Market's Compass
The Market's Compass@Mkts_Compass·
@Optuma @RRGresearch Brazilian Real, red horizontal lines on Weekly EWZ chart. The iShares MSCI Brazil Index Fund ETF or EWZ is up 8.27% vs. the EEM on a relative basis since the start of the year. The iShares MSCI Peru ETF, EPU, is up 14.95% vs. the EEM.
The Market's Compass tweet mediaThe Market's Compass tweet media
English
1
0
2
78
Optuma
Optuma@Optuma·
Here's the daily forex @RRGresearch chart showing the strength of major currencies vs the USD over the last 20 days. Among the strongest are Mexican Peso, Brazilian Real, & Chliean Peso. Indian Rupee is the only one lagging. $DXY
GIF
English
1
2
8
1.3K
Julius de Kempenaer | RRG® retweetledi
CMT Association
CMT Association@CMTAssociation·
Then, 𝐂𝐞𝐝𝐫𝐢𝐜 𝐓𝐡𝐨𝐦𝐩𝐬𝐨𝐧, 𝐂𝐌𝐓, 𝐂𝐅𝐀, takes you through US Sector Asset Allocation with the Relative Rotation Graph (RRG), demonstrating how relative strength and momentum reveal leadership, laggards, and rotation through the business cycle.
English
1
1
4
750
Julius de Kempenaer | RRG®
Julius de Kempenaer | RRG®@RRGresearch·
@Lukasz1944293 @DKellerCMT First, the chart is QQQ, not SPX, and second, why would this matter? What I see is the first lower HIGH after an initial drop from ATH. Most, if not all, declines, not only SPX or QQQ, start like this ...
English
0
0
0
14
Quant Lucky
Quant Lucky@Lukasz1944293·
@DKellerCMT Show me just one case where the SPX had fall from an ATH of at least 17%, and then made a lower low within the next 12-months. Just one.
English
5
0
5
971