Sabitlenmiş Tweet

To request a free demo of our advanced charting and analysis software see here: optuma.com/trial/
English
Optuma
4.7K posts

@Optuma
Empowering Traders, Analysts, and Portfolio Managers to discover unique market opportunities with powerful software and valuable education.


The 1st time that the $SPX has closed lower for 4 straight days with more stocks advancing then declining on every day:

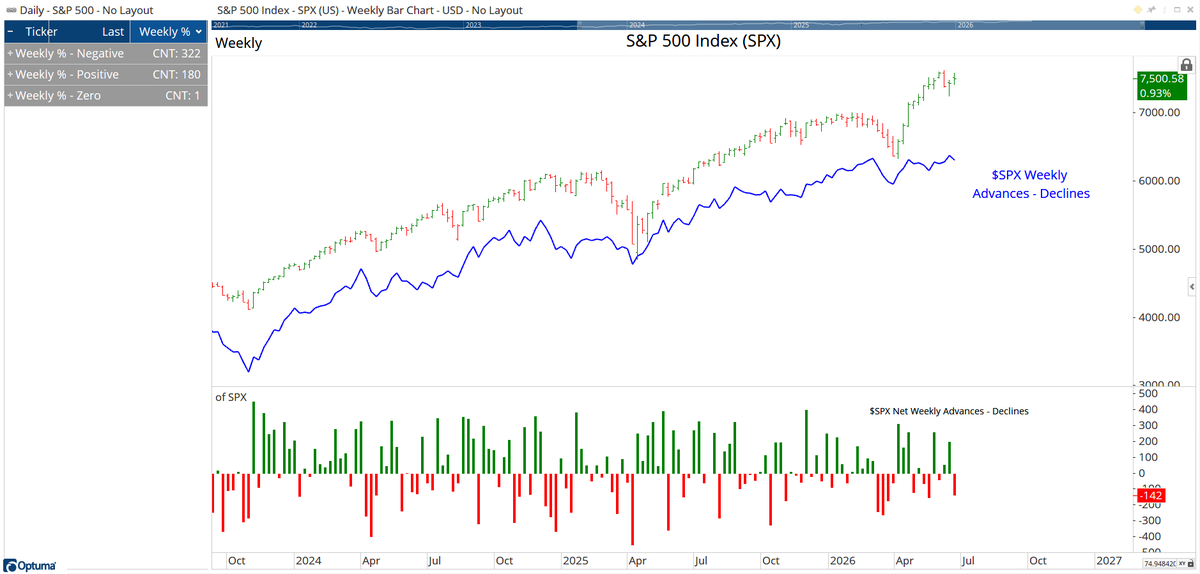
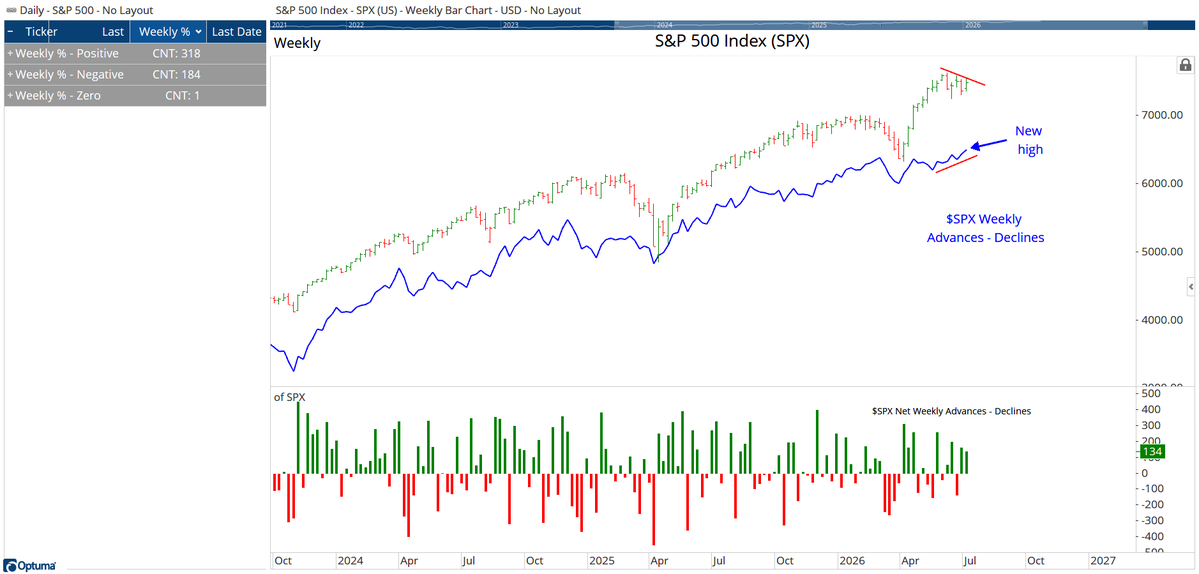
$SPX weekly advance/decline line made a new high on Friday, with 348 members gaining on the week: