RAIYD

2.7K posts

RAIYD banner
RAIYD

RAIYD

@Raid_49

specialist in biology, interested in trading the American Stock

جدة, المملكة العربية السعودية Katılım Eylül 2017
2.2K Takip Edilen393 Takipçiler
RAIYD retweetledi
الأدب العربي
" فَيا نَفسُ طيبي ثُمَّ يا نَفسُ أَبشِري فَـغَيـرُ بَعيـدٍ كُـلُّ ما هُوَ آتِ "
الأدب العربي tweet media
العربية
1
17
110
6.3K
RAIYD
RAIYD@Raid_49·
سجل العقد بجلسة الاثنين 99 سنت ربح ما يقارب 400% من سعر الدخول 20 سنت ولله الحمد خرجت من العقد .
العربية
0
0
1
56
RAIYD
RAIYD@Raid_49·
العقد سجل 0.70 سنت ربح 250% و لله الحمد
العربية
1
0
1
28
RAIYD
RAIYD@Raid_49·
$F 14.60 جاهز للهبوط
RAIYD tweet media
العربية
1
0
0
67
RAIYD
RAIYD@Raid_49·
#سيب_ايه_قرانيه #عقارات #اليوم_العالمي_للمتاحف #دار_عوضه
QME
0
0
0
60
RAIYD retweetledi
Insider Wire
Insider Wire@InsiderWire·
#BREAKING: 2 Navy Super Hornets jets crash midair during airshow in Idaho.
English
142
218
1.3K
372.2K
RAIYD retweetledi
A.M. 💵 💰
A.M. 💵 💰@The_Mardini·
بالنسبة للسوق الأمريكي ارتفاع لمدة 7 اسابيع متواصلة بدون اي تصحيح زاوبة صعود حادة جدا فوق 80 درجة ارتفاع يفوده عدد محدود من الشركات بينما معظم الأسهم بالسوق هابطة شخصيا اراه صعود وهمي. وصل مراحل الفومو بقوة على شركات الرقائق واشباه المواصلات. بينما 80% من الشركات المدرجة كانت هابطة وايضا من علامات الحذر الكبرى صعود ناسداك وسباكس وتسجيل قمم كل يوم بينما الداو جونز اكتفى بقمة مزدوجة وكان عاجز عن الصعود صعود بهذا الشكل يتبعه هبوط قبيح وقاسي ان هبط السوق الأمريكي الأسبوع القادم بقوة. سيسحب معه كل شيئ حرفيا. حتى الذهب والفضة ستهبط معه بقوة عندنا الأربعاء نتائج NVDA وهذا اخر أمل لمواصلة الصعود. وبعدها لايوجد اي حافز او مؤثر Sell in May and go away
A.M. 💵 💰 tweet media
العربية
5
3
50
9.8K
RAIYD retweetledi
NoName
NoName@WhaleNoName·
🚨 PAY ATTENTION TO THIS S&P 500 CHART 🚨 This is a historical crash pattern overlaid on today's price action The overlap is almost perfect The circles mark where the current structure confirmed the fractal 3 out of 3 Do you believe in this outcome?
NoName@WhaleNoName

🚨 S&P 500 IS PREPARING FOR A CRASH 🚨 The broadening wedge is fully formed: - Phase 6 = top at $7,450 - Phase 7 = breakdown to $6,200 But the geometry isn't the scariest part 35% of the entire S&P sits in 8 names - and Meta is already down ~10% in market cap One more crack and the rally story dies in a single session The chart shows where it goes. The breadth shows why NOTIFS ON!

English
28
37
170
68.8K
RAIYD
RAIYD@Raid_49·
أحيانًا تُطفئ الحياة نورًا صغيرًا… لتريك السماء كاملة. هارد لك يا نصرواي وان شاءالله نفرح بالدوري قريبا 💛💙💛 #النصر_غامبا_اوساكا
العربية
0
0
0
206
RAIYD retweetledi
MARMOT
MARMOT@Web3Marmot·
🚨 WARNING: BIG STORM IS COMING!!! Today Kevin Warsh officially took the Fed chair seat. Every time the Fed chair changes, Bitcoin crashes. Jan 2014: Yellen → BTC -83% Feb 2018: Powell → BTC -73% May 2022: Powell → BTC -61% May 2026: Warsh → WE ARE HERE The crowd is calm because he's PRO-CRYPTO. But the macro data is flashing red. CPI: 3.8% (3‑year high) Core CPI: 2.8% (8‑month high) Real wages: negative (first time in 3 years) Now look at the conflict. Trump wants rate cuts. But the data says no. Cutting would crash the dollar. Warsh has no winning move. Whatever he chooses, volatility is guaranteed. Remember, I've called every major turn for the last 10 years, including the $111K top in October. When the real bottom forms, I'll announce it here publicly, like I always do. Turn notifications on. Most people will follow me too late.
English
45
91
430
127.5K
RAIYD retweetledi
The Factor Report
The Factor Report@PeterLBrandt·
First interest rates Next Crude Oil??? Will Trump soon be thumped
The Factor Report tweet media
English
41
45
459
51.4K
RAIYD retweetledi
Pepesso
Pepesso@0xPepesso·
🚨 EVERY MAJOR S&P 500 CRASH WAS PRECEDED BY A MACD PEAK Just look at the chart: 2000 top: MACD peaked at ~100 -> index dropped -49.60% 2008 top: MACD peaked at ~75 -> index dropped -57.69% 2026: MACD is sitting at 496 The peaks that caused 50% crashes don't even register on the same scale as where we are right now Every single time this indicator turned from elevated levels - major crash followed Current reading is 5x higher than anything that preceded a major crash in 30 years of data I don't know exactly when it turns. But when it does, there's no historical reference for what follows Position accordingly!
Pepesso@0xPepesso

🚨 WARREN BUFFETT WENT ALL IN SELLING His sell-to-buy ratio just hit 15:1 This happened only twice in history: Dot-com Bubble crash in 2000 and AI Bubble right now $397,000,000,000 idle in cash Buffett Indicator at 227% vs 88% historical average This man definitely knows something and preparing for max pain scenario Save this. Let's see who's right by Q4.
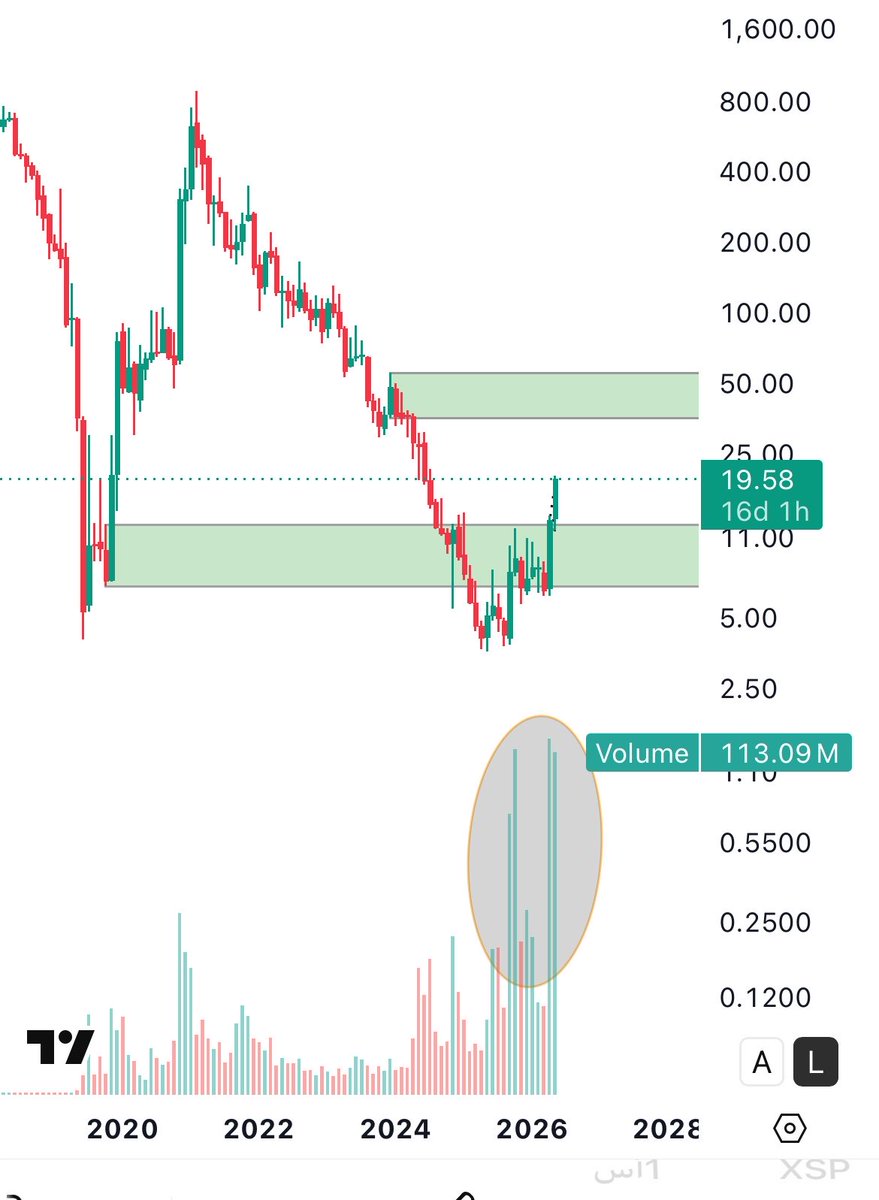
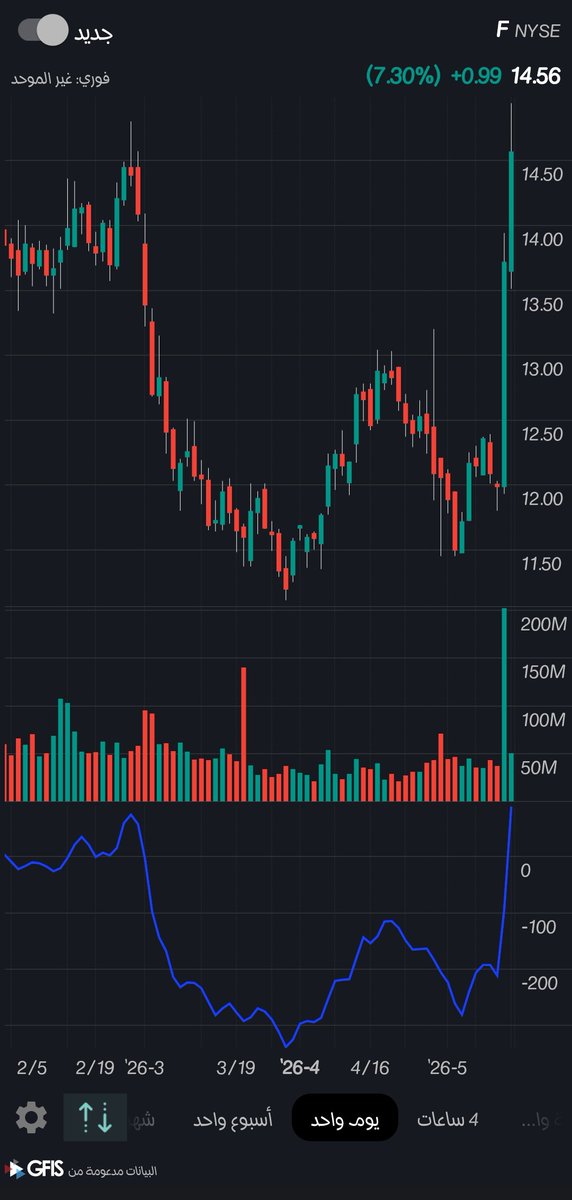
English
33
104
507
145.7K
RAIYD
RAIYD@Raid_49·
@waelalfayez الله يوفقك ويزيدك من فضله صيده موفقه
العربية
0
0
1
44
RAIYD retweetledi
Wise Advice
Wise Advice@wiseadvicesumit·
🚨 1 year ago Michael Saylor said people should “sell a kidney, not Bitcoin” Today? He’s openly discussing selling $BTC 🤯 And no… this isn’t bearish the way most people think. This may actually be the moment the entire $MSTR strategy evolves. 🧵👇
Wise Advice tweet media
English
12
15
59
3.6K
RAIYD retweetledi
bee🐝
bee🐝@0xbeehive·
S&P 500 JUST HIT THE CEILING OF AN 8-YEAR CHANNEL Just take a look and think about it: Price has been climbing inside this channel since 2018 - and just touched the top resistance for the first time But while price kept making higher highs, RSI has been making lower highs for 8 years straight That combination has a name: classic divergence This isn't a new signal - it's been building the entire time Most people weren't paying attention Now price is exactly where it has no room left to go FOLLOW + NOTIFS ON!
bee🐝@0xbeehive

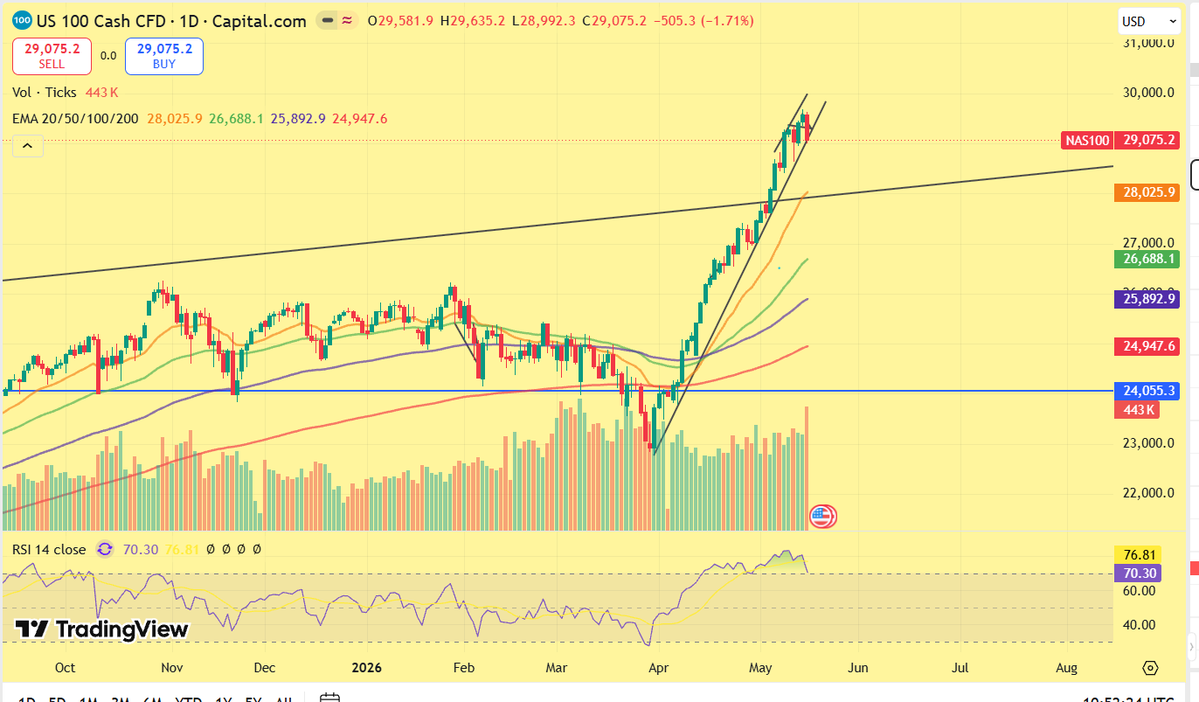
S&P 500 IS NOT AS STRONG AS IT LOOKS The price keeps going up - awesome! BUT The RSI is in a downtrend, as well as the OBV And this gap between the price and the actual state of affairs is exactly what distribution looks like before a significant peak forms From here I expect distribution with a possible bounce to $7,300 to trap the last buyers Either way, the final result is flush crash just like in October 2025

English
8
27
111
65.9K
RAIYD retweetledi
Mike
Mike@MarketMike·
Almost nobody looks at this chart… but it’s one of my favorite ways to spot when a move may be running on fumes. This is a simple 60‑minute line chart of high yield vs SPY. I use it to track divergences between “smart money” (bonds) and “dumb money” (equities). The last major signal was at the bottom, high yield quietly started putting in a higher low while stocks were still puking. That helped flag the turn. Fast‑forward to now: $JNK and $HYG are not confirming this latest push in SPY. Stocks are pressing higher, high yield is stalling out. That doesn’t guarantee a top, but when "Smart Money" refuses to play along, I take note.
Mike tweet media
English
119
459
2.5K
308.3K
RAIYD retweetledi
Vandy_trades
Vandy_trades@vandy_trades·
Wednesday is FOMC ( Powells last) + $MSFT, $AMZN, $GOOG and $META earnings Thursday is GDP, personal income AND PCE ( the feds main inflation indicator) + $AAPL earnings. There is going to be AMPLE opportunity this week. Just spent the last 2 hours charting and putting trade ideas up. Its going to be a wild week!
English
2
2
32
2.9K
RAIYD retweetledi
The Great Martis
The Great Martis@great_martis·
Ladies and gentlemens, dignitaries, royals, celestial beings… The data centre trade powering this AI frenzy is reaching a boiling point. Look at DTCR the Global X Data Center & Digital Infrastructure ETF on the daily chart. We’re staring at record breaking volume on a session that gapped higher, formed a textbook Evening Star reversal pattern right at the upper trendline, and then immediately sold off hard. That pink oval marks the heaviest volume on record. What about the delta volume shown below ? That’s the exit liquidity The core data centre REITs inside DTCR (Equinix, Digital Realty, etc.) are trading at hyper valuations many sporting P/Es north of 50–80x while the sector is in the middle of an unprecedented capital expenditure binge. Hyperscalers and AI players are guiding toward $630–700 BILLION in combined 2026 capex. That’s nearly double the already-record 2025 spend. This is starting to rhyme with the late stage Dotcom boom explosive infrastructure spending, sky-high multiples, and the belief that “this time it’s different” because of a transformative new technology. History doesn’t repeat, but it often rhymes. Risk management over euphoria. Yours truly, The Great martis ✨ God bless and godspeed.
The Great Martis tweet media
English
21
87
685
60.9K