ماجھا اور مالوا پنجابی کے دو مشہور لہجے ہیں دونوں کہ الفاظ تلفظ میں واضح فرق ہے لیکن کسی نے نہیں کہاں کہ یہ علحیدہ زبان ہے جنوبی پنجاب میں پنجابی کے لہجوں ملتانی ڈیروی ریاستی پنجابی کو بلوچ سندھی سیٹلرز اسی بنیاد پر تقسیم کرنے کی کوشش کرتے ہیں
In 90 seconds, you can learn a large portion of the math behind how neural networks actually work. It's a very simplified picture, but let me show you the actual math.
Every neural network has three kinds of layers: an input layer, one or more hidden layers, and an output layer. Each layer is made of neurons (the dots), connected by edges. Every edge carries its own weight: a single number.
Your input word or text input goes through a transformation into number form to enter the AI model - check out my "AI is math" video. That transformation is called an embedding, and I have an explAIned video on those as well.
In real models an embedding can be hundreds of numbers long; here I will use just two.
Say the input is 5 and 2.
Now give each edge a weight. To reach one neuron in the hidden layer, two edges feed into it: one with weight 10, one with weight 2. The neuron's value is 5 x 10 + 2 x 2, which is 50 + 4, so 54 (remember PEMDAS, my friends!!).
The neuron beside it has its own edges, say weights 20 and 4. Its value is 5 x 20 + 2 times 4, which is 100 + 8, so 108.
Multiply each input by the weight on its edge, add the results, and pass the number forward. Do it again for the next layer, and the next. Basically every generative AI model you use runs on this.
Btw - we don't go over them in this first video, but we're missing the *nonlinear* functions in this demonstration. I can make another video on those & why they are crucial to the neural networks. Also, the output layer works a little differently from the hidden layers, and I will cover that in Part 2. I can also break down how these weights are actually learned, through backpropagation. If that is of interest to you, or if you like this format, or if I can do better somehow, please let me know in the comments!
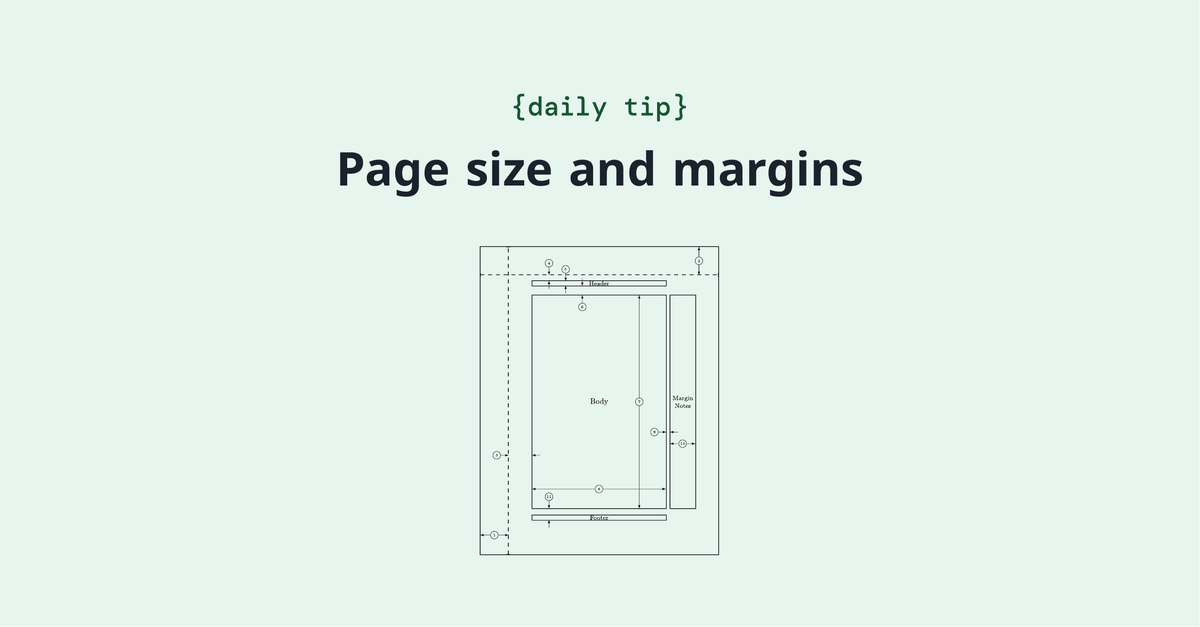
The geometry package provides an easy way to modify the page dimensions (ie., height and width) of your document. Check out our guide on working with page size and margins. overleaf.com/learn/latex/Pa…
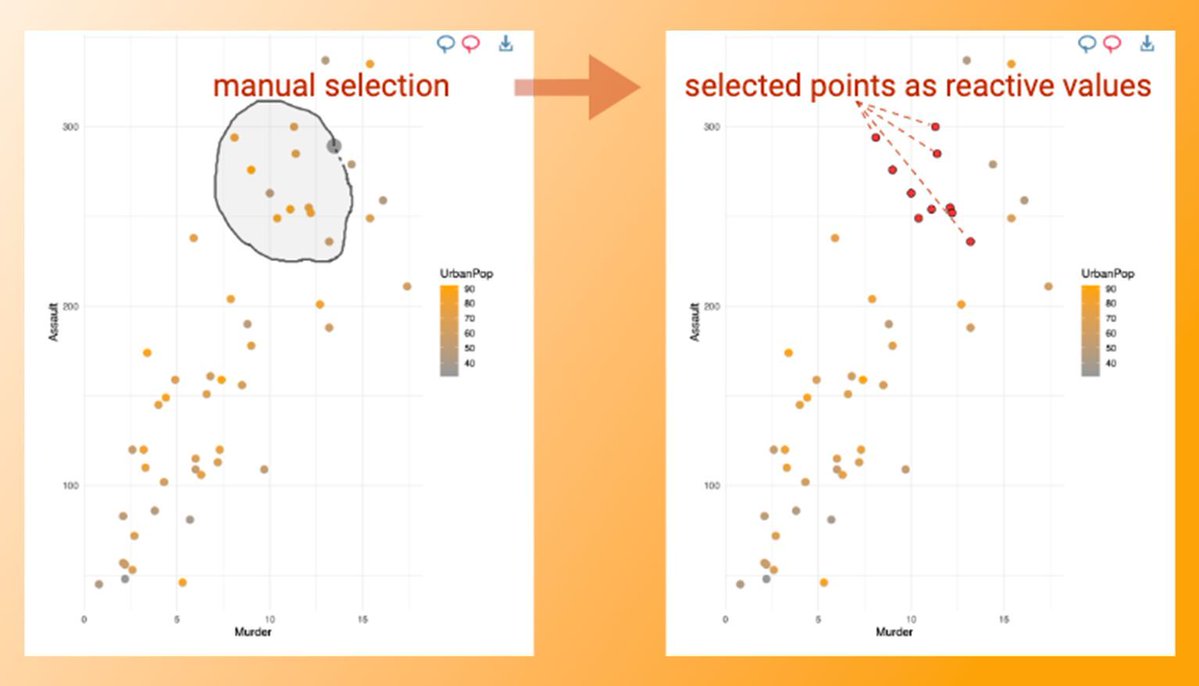
Add interactivity to your Shiny applications with ggiraph, an extension for ggplot2 in R. This package enhances ggplot2 visualizations and provides selection and manipulation capabilities within Shiny apps.
When you use ggiraph in a Shiny application, elements with an associated data_id can be selected and manipulated on both the client and server sides. The selected values are stored reactively in a variable named [shiny_id]_selected, allowing easy tracking and response to user interactions.
With ggiraph in Shiny, you can:
✔️ Enable Dynamic Selections: Allow users to select plot elements and respond to their choices in real time.
✔️ Manage Reactive Values Seamlessly: Access selected data through [shiny_id]_selected, integrating smoothly with other reactive elements.
✔️ Customize Interactions: Use data_id to link specific plot elements to actions or responses, adding depth to user engagement.
Integrating ggiraph into Shiny enables a new level of interactivity, helping you create dynamic, responsive visualizations that elevate your application’s user experience.
The visualization example featured here is from the ggiraph package website and showcases these interactive capabilities in action: davidgohel.github.io/ggiraph/
If you’re looking to deepen your skills with various visualization techniques in R, consider joining my course, "Data Visualization in R Using ggplot2 & Friends!"
More information: statisticsglobe.com/online-course-…#StatisticalAnalysis#VisualAnalytics#datavis#Rpackage#Data#tidyverse
زخم ہرے ہو گئے 🥲
ابھی بریک میں ایسی ہی اسکرول کر رہی تھی تو اچانک یوکے کی یہ ویڈیو سامنے آ گئی، نہ جانے مجھ جیسی کون بدنصیب سنگل مدر ہے جو کسی ظالم مرد کے ظلم کا شکار ہوئی ہے
PNAS waives article processing charges (APCs) for eligible authors from lower-income countries and those unable to afford publication fees, helping support global participation in scientific research. Learn more: ow.ly/2OfQ50Zl6Bv
PhD Students - How to write a thesis?
Divide your thesis into the following sections.
- Preliminary Section
- Chapter 1: Introduction
- Chapter 2: Literature Review
- Chapter 3: Methodology
- Chapter 4: Results
- Chapter 5: Discussion
- Chapter 6: Conclusion
- Ending Sections
For more, join my free webinar on 8th July.
Topic: How to conduct a literature review
Registration Link:
us06web.zoom.us/meeting/regist…
Struggling with too much data? See how Principal Component Analysis (PCA) makes it easy to find the patterns and insights hidden in your data, all in a simple, powerful way!
1️⃣ Data Simplification: PCA reduces the dimensionality of your data set. This means transforming complex, high-dimensional data into a simpler, manageable form without losing its essence. It's like summarizing a long book into a concise summary that still captures the main points.
2️⃣ Enhanced Visualization: With fewer dimensions, PCA allows us to visually explore and understand complex data sets. Imagine going from a tangled web of data to a clear, 2D or 3D plot that highlights patterns and relationships.
3️⃣ Improved Performance: By focusing on the most relevant features, PCA can speed up learning algorithms, making your data analysis not just faster but also more efficient.
4️⃣ Noise Reduction: PCA helps in filtering out noise (unimportant variations) from the data set, making the true patterns more pronounced and easier to analyze.
5️⃣ Easier Data Interpretation: With PCA, the complexity of interpreting data is significantly reduced. By identifying the principal components, analysts can focus on the most influential factors driving the trends and patterns in the data.
6️⃣ Resource Optimization: Less data means less storage and computational resources are needed. This is crucial for handling large data sets effectively and can lead to cost savings.
PCA is not just a mathematical technique; it's a strategic approach to dealing with data in the most efficient way possible.
Curious about PCA and its applications in R programming? Join my online course, where we'll dive deep into PCA theory and practical usage in R.
For more information, visit this link: statisticsglobe.com/online-course-…#Python#RStats#DataViz#R4DS#datastructure