Shanky choudhary retweetledi
Shanky choudhary
3.4K posts

Shanky choudhary
@Shankyror
Intellectual
burlington ontario Katılım Haziran 2012
768 Takip Edilen84 Takipçiler


Shanky choudhary retweetledi

Repeat after me
#BringBackAnnamalai
Now . Trend it 50K plus RT needed . Let the Modi ji hear our Voice . Our Voice matters

English
Shanky choudhary retweetledi

🔴 @LumiTraders LIVE — Win Prop Firm Accounts! 🎁
📺 youtube.com/live/P7fP02uYi…
Watch live to win! Enter: Funded.Now/giveaways
@Funded_Now #PropFirm #Trading #FundedNow

YouTube
English
Shanky choudhary retweetledi
I put together some of my trading lessons for you guys.
No likes. No reposts. No comments needed.
Just study it, backtest it, and use it. 🤝
1️⃣ Price Delivery: drive.google.com/file/d/1rA1Li2…
2️⃣ Top-Down Analysis:
drive.google.com/file/d/1Xh48AE…
3️⃣ MMXM:
drive.google.com/file/d/1tqRtSD…
4️⃣ Standard Deviation Projections:
drive.google.com/file/d/1FuoiPs…
5️⃣ Optimal Trade Entry (OTE):
drive.google.com/file/d/1x7Dcnq…
6️⃣ NY Midnight Open:
drive.google.com/file/d/130E_1y…
7️⃣ PO3 / AMD:
drive.google.com/file/d/1HDNZck…
8️⃣ Liquidity Sweep:
drive.google.com/file/d/1PL8K0r…
9️⃣ TGIF:
drive.google.com/file/d/1oWJnpk…
Save this post. One lesson from this post can completely change your trading. 📚

English

It's easy to miss me, when there are so many trying to sell you something, all the while claiming to be profitable or "rich", huh?
Shameful lot, aren't they. lol
GIF
English
Shanky choudhary retweetledi


Shanky choudhary retweetledi

Dollar direction tells you everything:
If Dollar is bearish:
EURUSD will be bullish
XAUUSD will be bullish
Indices will be bullish
Dollar direction sets the tone for everything.
Study it.
English
Shanky choudhary retweetledi

ICT Tip💡:
The opening range gap (ORG) is the price difference between 4:14pm settlement price previous day and 9:30am opening price current day.
Anticipate price to trade to the CE (50%) of the ORG within the first 30min of the opening range post 9:30am, 70% of the time.
English
Shanky choudhary retweetledi

Trading an SMT Break
1. Identify a true reversal
2. Identify the opposing side of the range (DOL)
3. Once the leading asset engages the draw and fails to manipulate (reverse) frame continuation of the lagging asset from a gap
4. Demand a SS if the leading asset has no further close proximity draws.
5. Execute relentlessly; win or loss, this has edge.
English
Shanky choudhary retweetledi
Shanky choudhary retweetledi


Shanky choudhary retweetledi

Shanky choudhary retweetledi

Shanky choudhary retweetledi

“This session was deleted by Richthebull & Zeussy on TAPDA ⌛️
They never wanted this getting out to the public 🚨
There’s a reason this was taken down…
Watch closely. Take notes.
Some of you will finally understand what’s really going on.”💡
English
Shanky choudhary retweetledi


Shanky choudhary retweetledi

Shanky choudhary retweetledi

go pull up YM next to your NQ chart right now
this one asset tells you every fake breakout on NQ before it happens
and almost nobody watches it
a trader in my program avoided 11 out of 13 fake breakouts last month by checking one thing on YM before entering on NQ
here's the exact system:
THE YM DIVERGENCE FILTER:
everyone watches NQ and ES. that's it. two charts. side by side. all day
nobody watches YM
that's why they keep getting wicked out
YM is the weakest index. it moves slower. it lags behind NQ and ES. it doesn't have the tech stocks driving momentum
and that's exactly why it's the most honest chart in the market
when NQ and ES are both ripping higher, YM tells you if the move is real or fake
here's how:
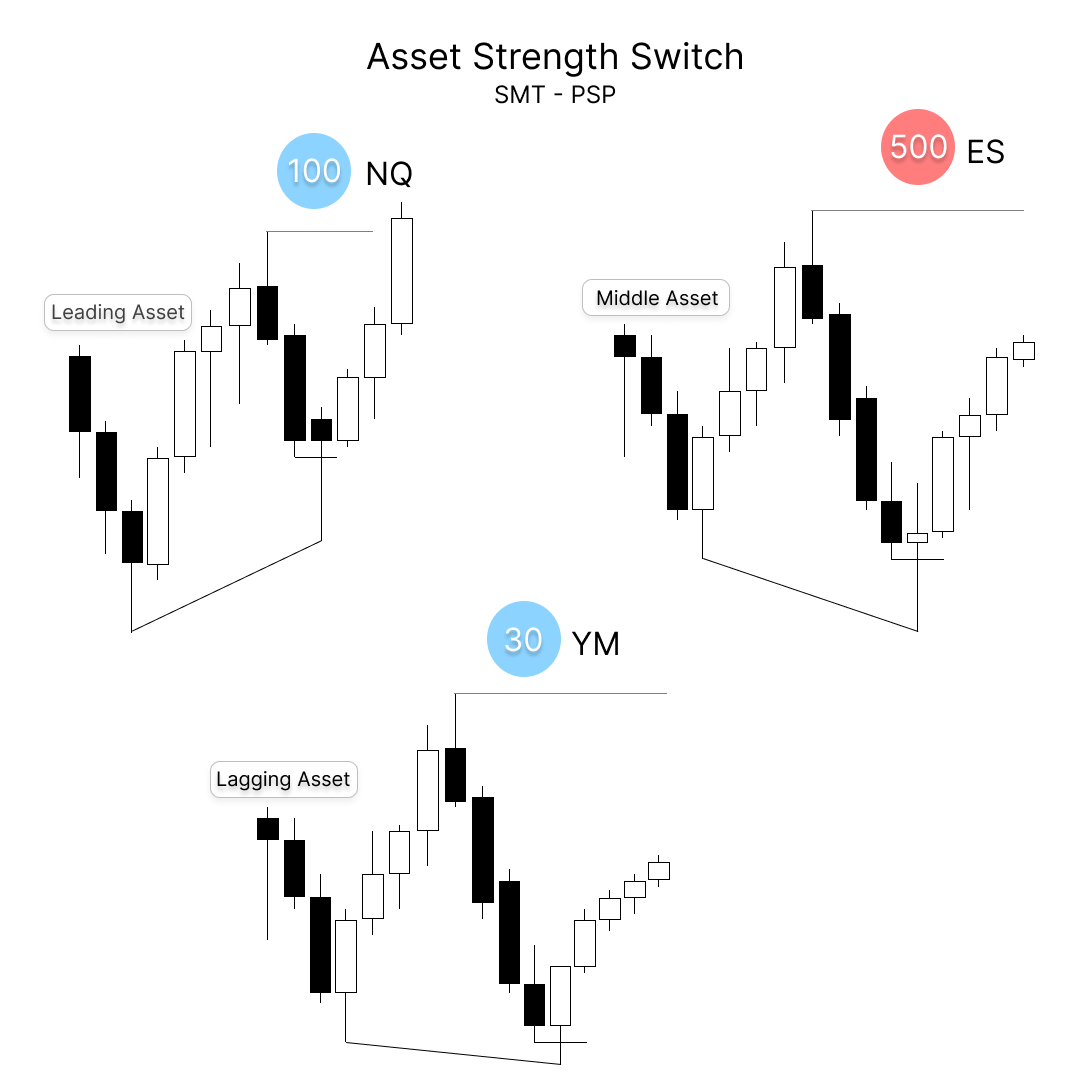
REAL MOVE: all three assets are making the same highs at the same time. NQ leads. ES follows. YM confirms. when YM is also making new highs, the move has full institutional commitment. trade it
FAKE MOVE: NQ makes a new high. ES is close. YM isn't even in the same zip code. it's sitting in the middle of the range or barely made it past the previous candle's high. that divergence is institutions telling you they're not committed to this breakout. NQ just grabbed liquidity. it's about to reverse
this is SMT. smart money technique. a crack in correlation between assets that should be moving together
but here's what nobody teaches you about YM specifically:
YM is the FIRST asset to show that
when the market is about to reverse, YM switches from lagging to leading. it goes from the weakest asset to momentarily the strongest. it starts closing candles in the opposite direction while NQ and ES are still pushing
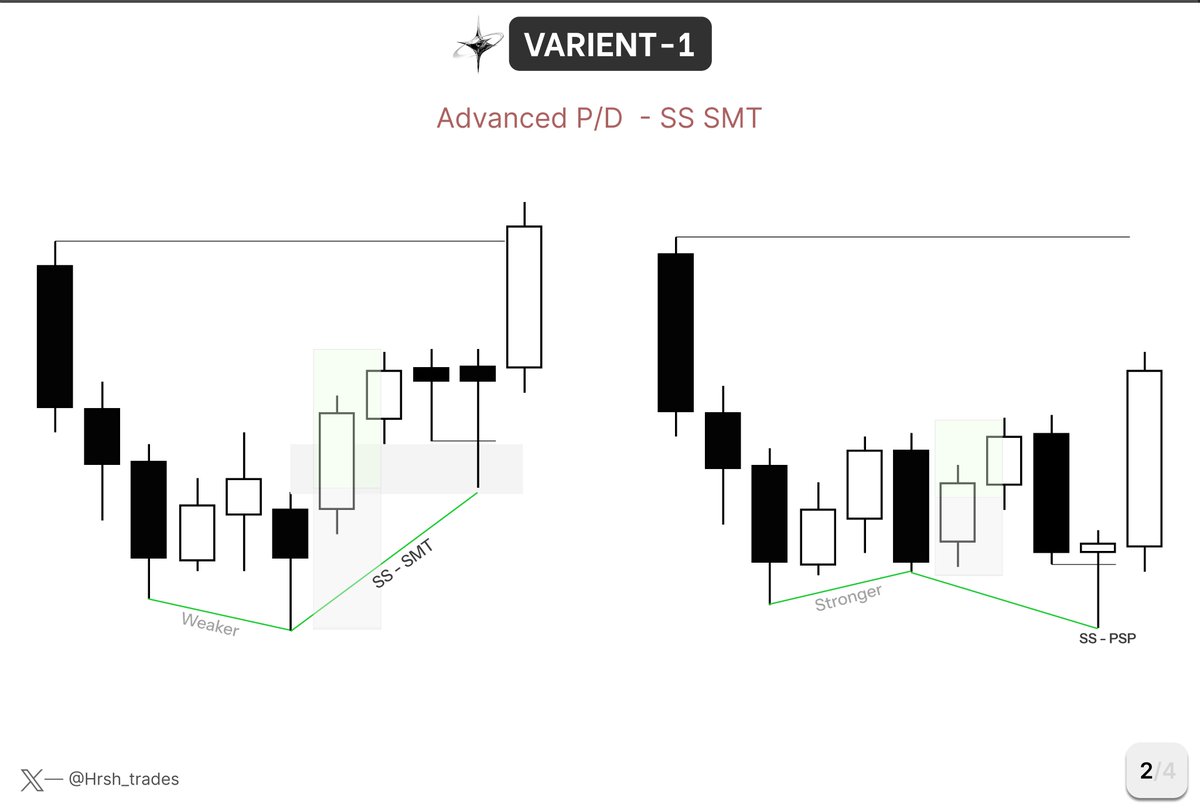
when you see YM close a bearish candle while NQ closes bullish at a key level - that's your strength switch PSP. that's the highest probability reversal signal in the market
i've tracked this across hundreds of trades. when YM confirms the move, win rate is normal. when YM diverges at a key level, the reversal happens within 1-3 candles almost every single time
HOW I USE IT EVERY MORNING:
6:00 AM - i open three charts. NQ. ES. YM. not two. three
6:05 AM - i check the 6AM candle on all three. did they all sweep the same level? did they all close the same direction? if yes, direction is confirmed. if YM didn't follow - i'm watching for the reversal
9:30 AM - price approaches a key level. previous day high, swing point, fair value gap. i check all three assets
both NQ and ES sweep the high but YM doesn't → crack in correlation → the sweep is fake → i'm looking for short entries on the reversal
all three sweep the high → no divergence → i wait. no trade yet. the reversal isn't confirmed
NQ sweeps the high and YM closes bearish on the same candle → strength switch PSP → highest probability entry of the day → enter short on the displacement candle, stop above the sweep, target the next relevant low
9:45 AM - trade is on or there's no setup. either way i'm done looking by 10:30
WHY THIS WORKS:
institutions can fake a breakout on one asset. they can even fake it on two
they can't fake it on three
NQ is the flashy chart. it moves fast. it creates FOMO. retail chases it
ES is the middle child. it usually follows NQ. doesn't tell you much on its own
YM is the lie detector. it's slow. it's boring. nobody watches it. but when it diverges from NQ at a key level, it's telling you exactly what institutions are doing before the move happens
the traders getting wicked out at every breakout are watching two charts
the traders catching every reversal are watching three
EXAMPLES:
NQ takes out the previous day high at 9:37 AM. ES is close behind. you check YM - it's not even near the high. it's sitting in equilibrium of the range. NQ reverses 4 minutes later. you're already short because YM told you it was fake
NQ sweeps a swing low at 10:02 AM. ES sweeps it too. you check YM - it already took that low out 30 minutes ago and reversed. leading asset already hit the draw. lagging assets are catching up. this is asset synchronization. you enter long on NQ targeting the gap above. YM already showed you the reversal was real
the difference between getting wicked out and catching the reversal is one chart you're not looking at
open YM tomorrow morning. put it next to your NQ chart. watch what it does at the first key level of the day
when NQ breaks out and YM doesn't follow - don't take the trade
when YM switches strength at a key level - that's your entry
you'll never trust a two-chart setup again
(free discord in bio. i teach my full framework there)
English
Shanky choudhary retweetledi

HOW ASIA PREDICTS LONDON
When Asia closes green → 78% chance London closes green
When Asia closes red → 79% chance London closes red
If you're trading London, Asia gives you the bias nearly 4 out of 5 times.
(5 years of data via @edgeful)

English