

@EricLDaugh Iran absolutely won! They got so many concessions and no discussion of the nuclear deal!
English
Macro Trader Strategies
495 posts
@StrategiesMacro
Macro & Global Markets | Crypto | Geopolitics | UAE-based Trader 📊 Cutting through noise with data-driven analysis. Follow for edge.




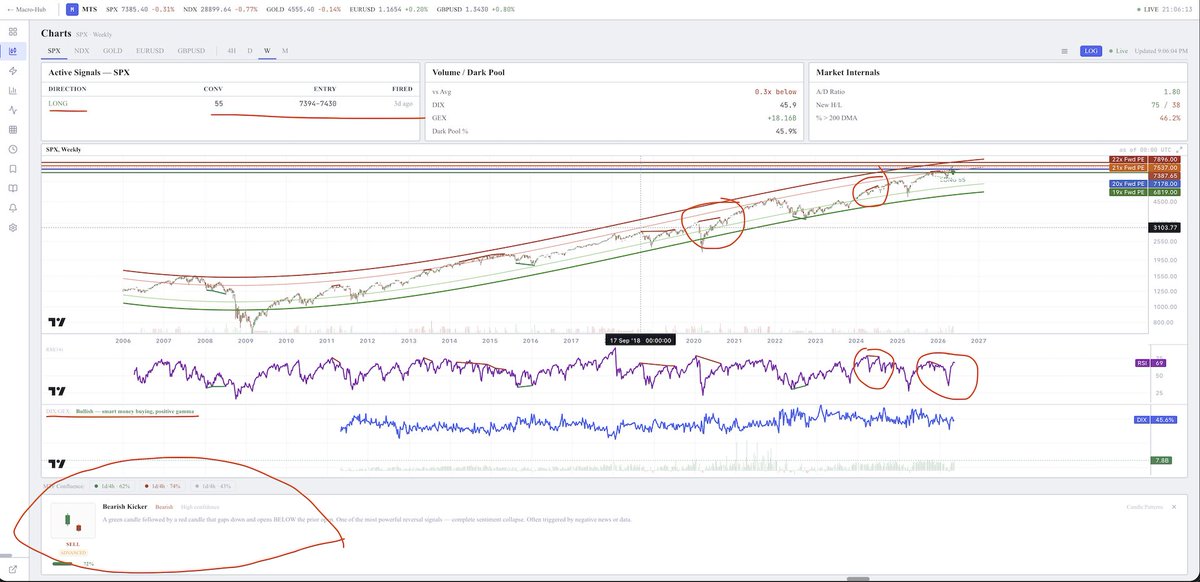
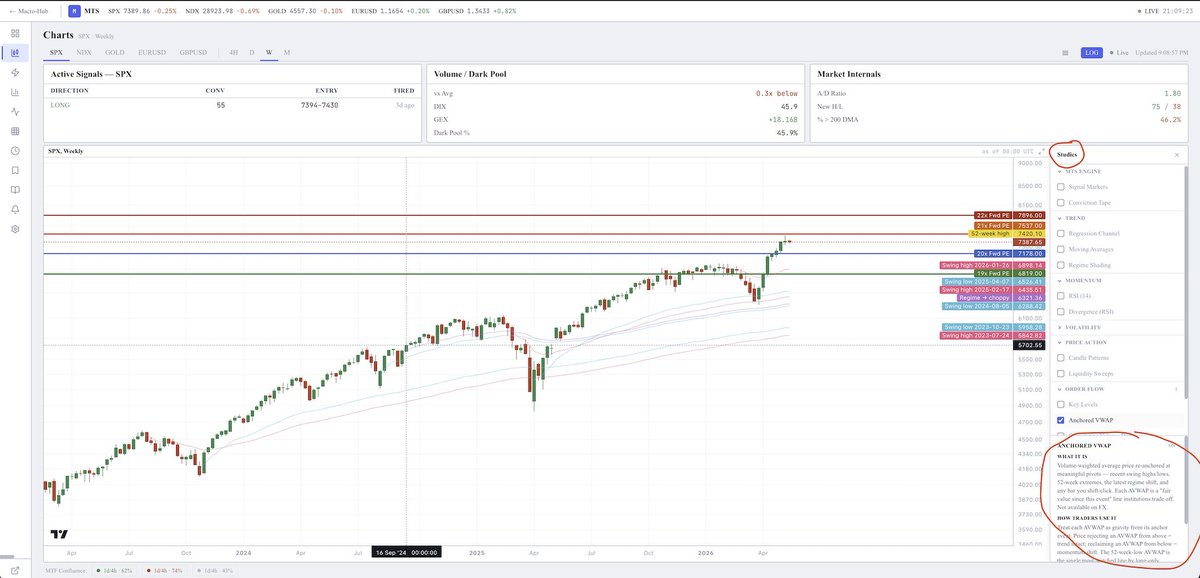


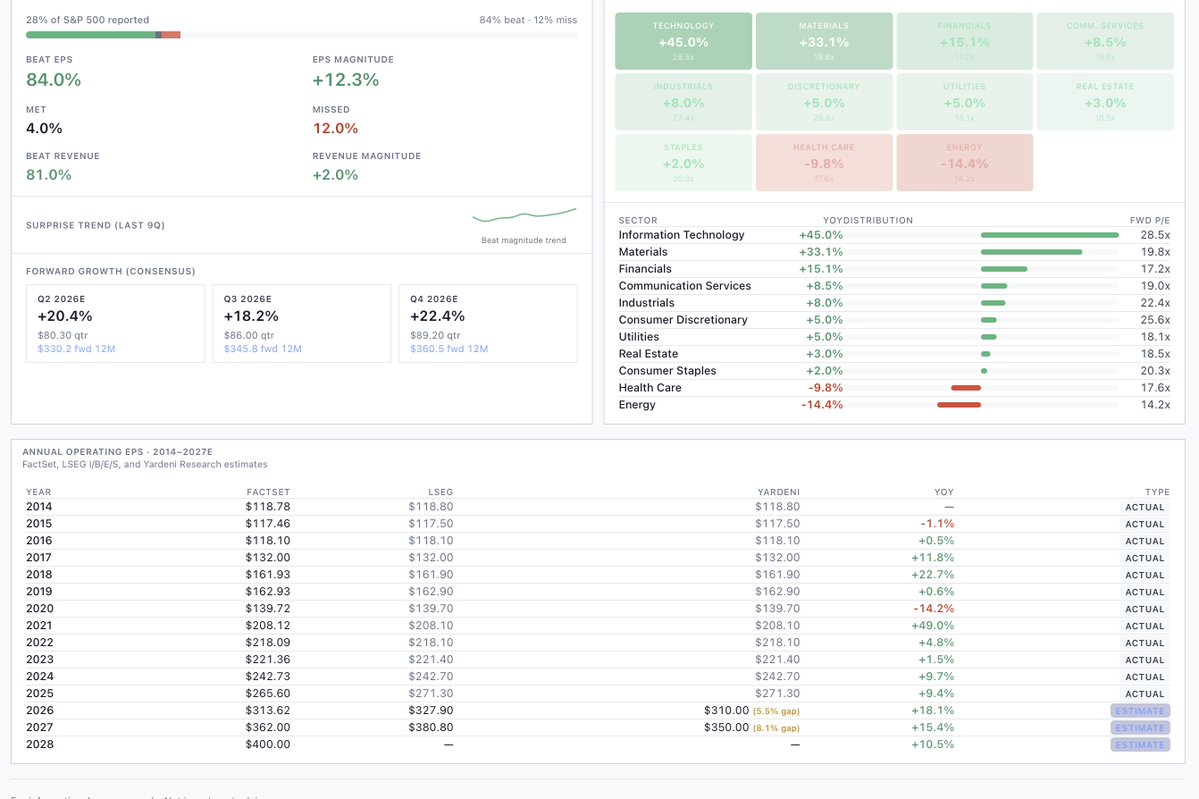


I noticed something when looking over charts this weekend.... Right now $QQQ is sitting at a daily RSI of 82.83 and is 14.50% above its 50 day simple moving average. I went back to see if there some similar setups and examples to this, and what the results were after. Here were some of the most recent. 1. June-July of 2024 before the "Yen Carry Trade" and the market dropped 16% in 17 days before pushing higher. 2. November-December of 2023 when Yellen basically put QE back on the table after the sweep of the summer. Market then pulled back 5% before resuming higher. 3. September of 2020- after the massive post COVID rally Q was almost 20% above it's 50 day average before experiencing a 14% pullback before pushing higher. The big things I was looking for was a extended rsi (Like 80 plus on the daily), and a large percentage away from the 50 day (blue line). History would say this is a time for concern, not euphoria. Yes, I've always said I believe the market resolves higher, but piling in here is a recipe for disaster. Not necessarily on the long term, but the short term. I think there will be a very buyable dip, but it's not here yet. I think most likely is a dip, then a new high with bearish rsi, followed by a much larger dip. I don't care what the narrative is, only what the chart shows me.

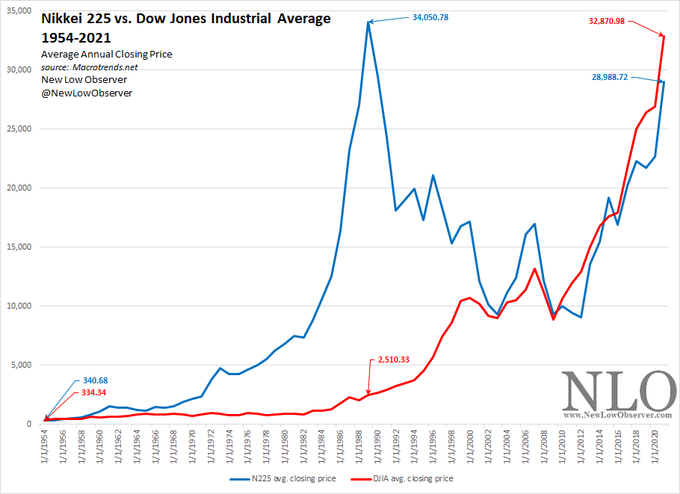
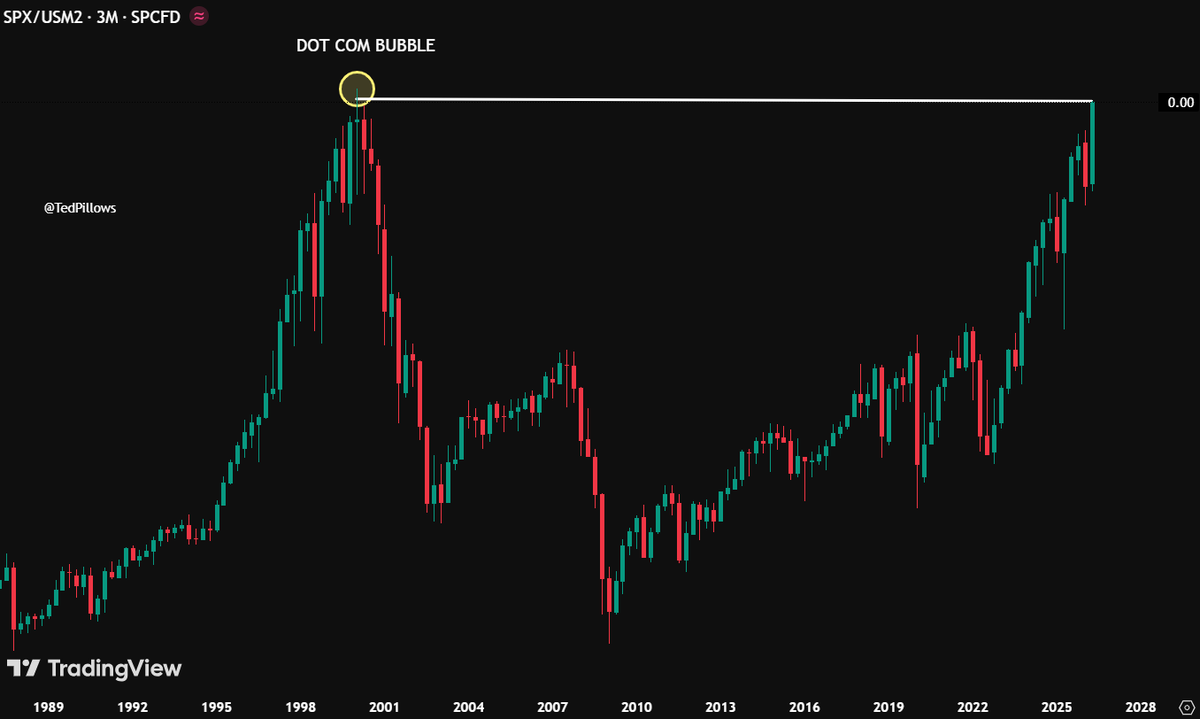
The U.S. stock market is tracking the 1989 Japan bubble. When that bubble burst, their market didn't recover for 40 years. So what's going on? In the 1980s, Japan saw a rapid surge in stock and real estate values. It was called "The Everything Bubble." The math was simple but dangerous: - Low interest rates flooded the market with cheap money. - Companies used that money to buy stocks. - Rising stock prices increased corporate valuations. - Higher valuations let those companies borrow even more money to buy even more stocks. Real estate in Tokyo was so expensive that the grounds of the Imperial Palace were worth more than the entire state of California! It was a perfect circle that worked till it didn't. In 1989, the market crashed 50 percent. Then it dropped a bit more. It did not fully recover for almost 40 years. Today, the S&P 500's trajectory looks the same. We see the same pattern of cheap money, massive debt, and a belief that prices can only go up. But there is one major difference this time: AI productivity and companies with real cash flows. While Japan was fueled by a real estate frenzy, the U.S. is fueled by companies like Nvidia and Microsoft generating massive cash flow. The question is whether that productivity can grow fast enough to outrun the debt. At the same time, we're also face a shrinking workforce and rising social costs. How will these forces work together? The goal is not to predict a crash but to prepare for any eventuality. I broke down the full data on the great melt-up and what it means for your portfolio on my Substack. I'll drop the link in the comments.




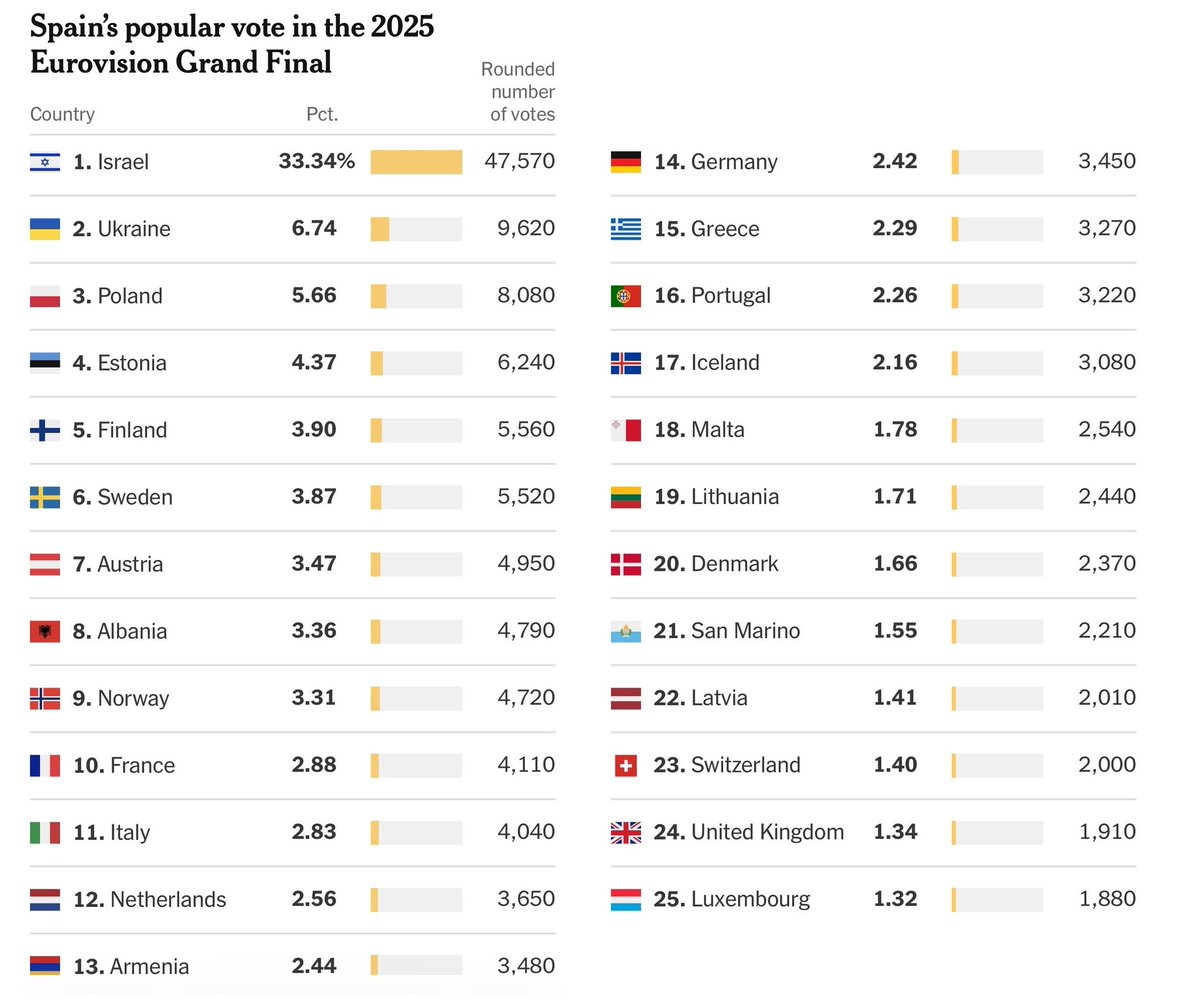
Eurovision boss: 'We're watching the voting very carefully' bbc.in/4u6T8Tc

The market is wrong about $META After the recent drop, coupled with explosive 33% revenue growth and 22% operating income growth, here's my updated DCF on Meta. If Meta can achieve: - Operating Income Growth 18% - Price/Operating Income 18x - Growth Decay 5% - 10% Discount Rate - 2.31% annual share repurchases Then the business should realistically return a 19.71% CAGR


