
@Apple has taken “filling the shelf space” to a ridiculous level. Multiple lookalike products with small differences that don’t do much different or new. What happens when innovation runs into commercialization.
English
Summit Global Strategies
10.9K posts

@SummitGlobal1
Optimistic capitalist. Understanding what’s important. Explaining it. Fixing it.
A Fed rate increase, once unthinkable, has become thinkable thanks to stubborn inflation, Iran and a resilient economy, @greg_ip writes on.wsj.com/47TUOq3
Thrilled to share my latest paper with @ChrisOdinet and @ProfYYadav1: The Moneyness of Stablecoins (forthcoming @YaleLJournal) papers.ssrn.com/sol3/papers.cf… What makes something money? Are stablecoins money? Are they good money? We try to answer these questions 🧵


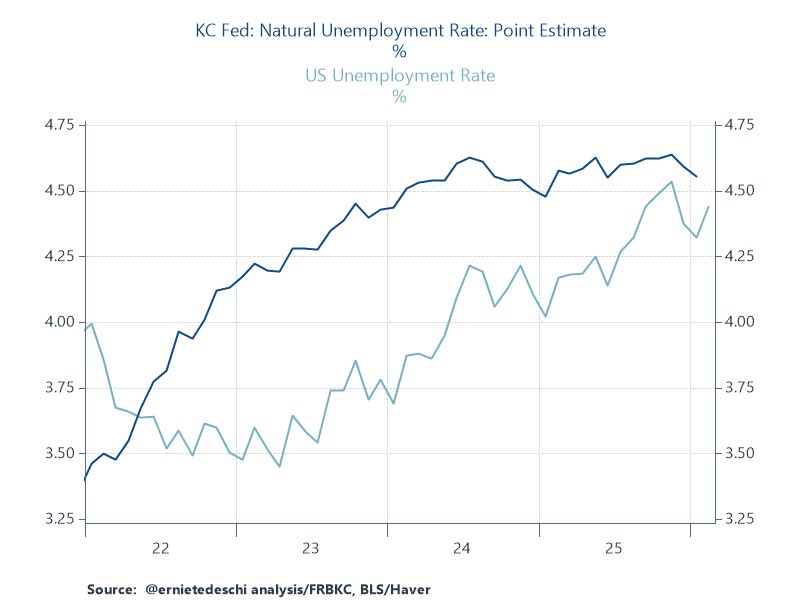
I basically agree. There are genuine anxiety closets in the labor market worth monitoring but the tenaciousness of wage growth & core services inflation suggest its state is still one of net heat overall. Modeling from the @KansasCityFed estimates we're still a bit below NAIRU.

Reis compares the IMF’s 2019 forecasts of increases in the public debt over the next 5 years with the actual increases. In OECD countries where deficits turned out to be higher than the IMF expected, inflation also turned out to be unexpectedly higher. edwardconard.com/macro-roundup/…
Using internal Stripe payment data, Tedeschi finds that spending growth of households in low-income zip codes has outpaced that of households in high-income zip codes since 2023, thus showing no evidence of the “K-shaped economy” in the consumer sector. edwardconard.com/macro-roundup/…

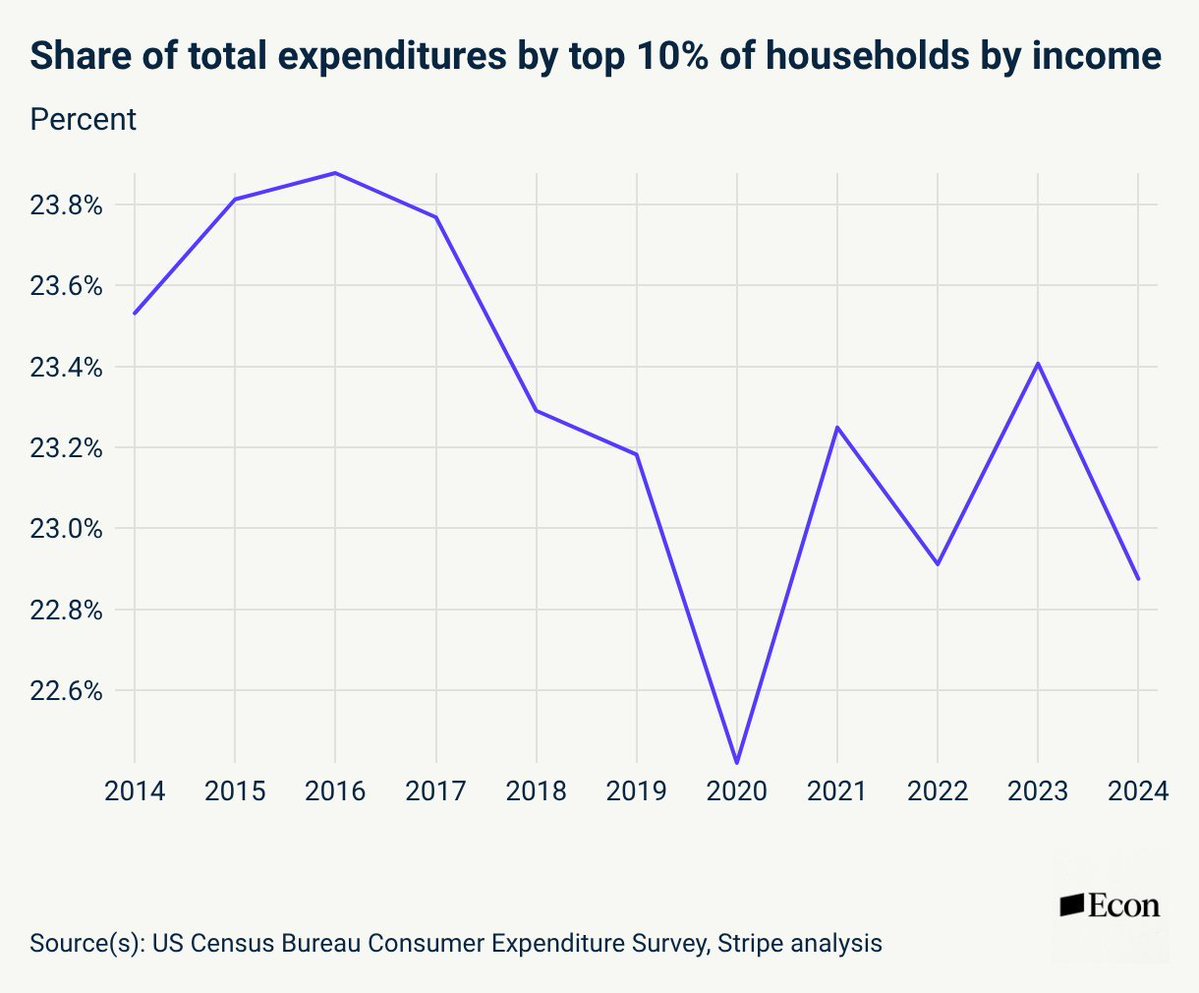
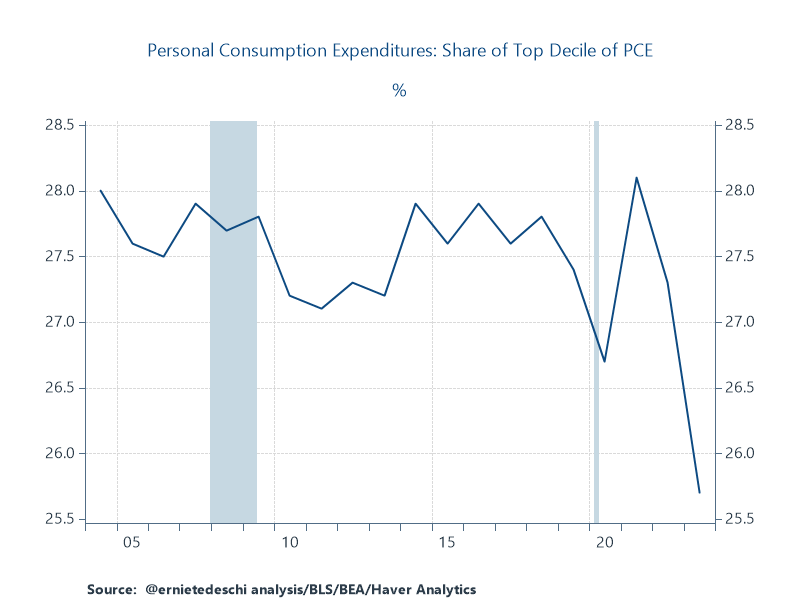
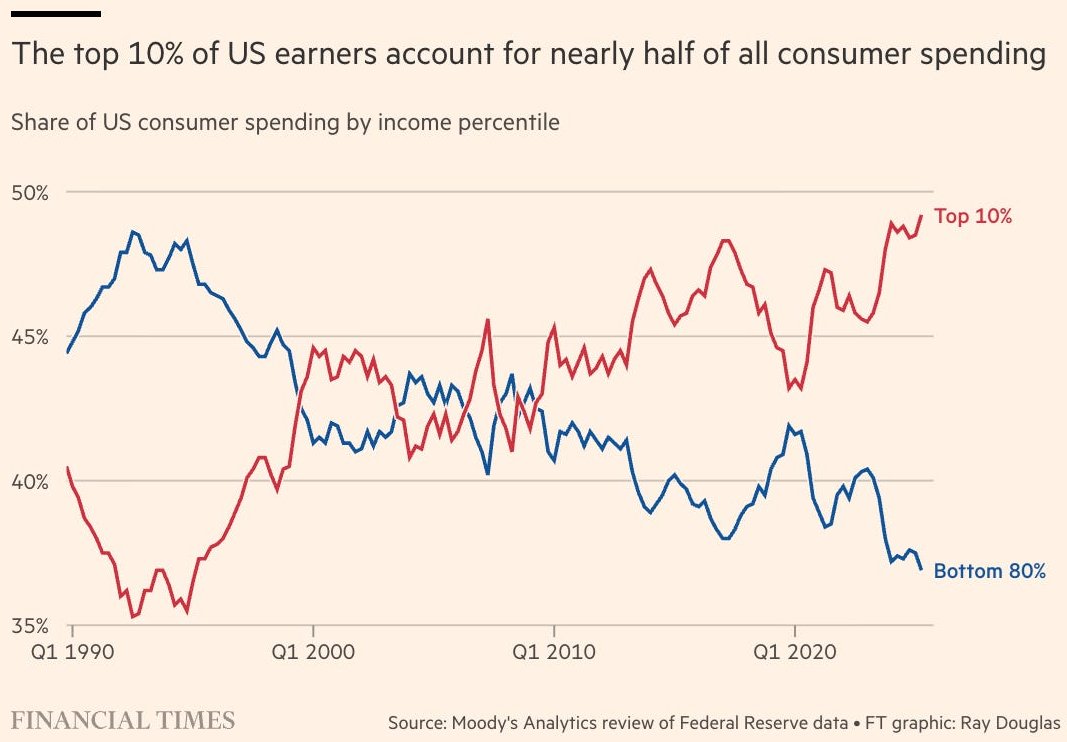
This graph has been floating around every couple months, arguing that the top 10% of earners account for 50% of consumption. Anyone familiar with economic statistics should intuitively feel it must not be right. So I dug into it a bit, and indeed, it's (mostly) not.

Is the Phillips curve useful to make sense of inflation? A.W.H. Phillips first postulated a negative empirical correlation between inflation and the level of economic activity. Looking at inflation in 2021-24---up and down---versus measures of unemployment---roughly unchanged---shows little correlation. Has the Phillips curve failed, yet again? No, it did not. Friedman and Phelps, almost 50 years ago, clarified that this correlation should only hold keeping expected inflation fixed. Almost every account of how firms choose prices or bargain wages with their workers predicts that expectations would show up in a Philips curve. Moreover, those models of behavior further add that increases in marginal costs (supply shocks) would further shift out this relation. The empirical Phillips curve has for many decades meant a negative relation between inflation and real activity, controlling for expected inflation and supply shocks. The left figure below shows on the vertical axis inflation, after controlling for expected inflation---mean and disagreement from a household survey---and for supply shocks---gas prices and global supply pressures. The horizontal axis shows a measure of slack in the labor market---the log of the ratio of unemployment to job vacancies. The Phillips curve held nicely and steadily throughout. A criticism of that figure is that its is looking in the rear view mirror: the measure of supply shocks and the measure of slack were developed in the last few years and the data has been revised. The right figure does instead an out-of sample exercise. Estimate a regression of inflation on (i) expected inflation, (ii) the difference between the unemployment rate and the CBO estimate of its non-cyclical component, and (iii) the PCE energy price index. Do it on data pre-pandemic: 1984Q1-2020Q1. Using that estimated equation, predict inflation in real time from then onwards using the data releases available at the time of the forecast. The Phillips curve was a pretty good predictor of inflation throughout. The Phillips curve was stable during the inflation surge, and it predicted well the movements in inflation, with expectations playing a key role in those predictions. Notes: it is important to include the right measure of expectations to understand inflation-activity dynamics at a business-cycle frequency: the short-horizon expectations of households and firms. (For instance, the long-horizon expectations from professionals, or the expectations from models in policy institutions, as in my previous two posts, are the wrong measure.) Sources: (i) Section 3 in Reis "Why Did Inflation Rise and Fall in 2021-24? Channels and Evidence from Expectations" (ii) The simple exercise on the left figure is inspired on the analysis of Bernanke and Blanchard “What Caused the US Pandemic-Era Inflation?” (iii) The simple exercise on the right figure is inspired on @jadhazell "Comment" in the NBER macro annual 2025, which in turn built on Beaudry, Hou, and Portier "The Dominant Role of Expectations and Broad-Based Supply Shocks in Driving Inflation"

I've been saying for years that GOP and Dems were in a game of chicken where the everyone runs up deficits and the object is to structure current taxes/spending so the other side's priorities absorb most of the burden of adjustment. I now think I was wrong.


Great reminder from @SamRo in a recent note that times change, but so do market composition. Railroads made up most of the US market in 1900, now it is a rounding error. In fact, 80% of the 1900 market is small or outright extinct today.

Let this sink in. California wealth tax architect Saez admits it here: he would let 80% of billionaires leave CA, liquidating Silicon Valley and its jobs, for an extra $2 billion per year in revenues. This is in a state that spends $325 billion per year, up by 68% since 2019.