Sabitlenmiş Tweet

Visualise trend.
Visualise momentum.
Trade with clarity.

English
SuperDots Trader
957 posts
@SuperDot_trader
Trader. Built SuperDots - a trend & momentum indicator. Helping traders see the market clearly.


$TAO just broke a level on the daily chart that has not been touched since March. Most people have not noticed yet. Price: $288.5 200-Day MA: $272.4 Timeframe: 1D + 4H confluence Exchange: Binance This is the breakdown. The daily chart tells the full story. Zoom out to the 1D and what you see is one of the cleanest base formations in the entire altcoin market right now. TAO peaked at $377 in November 2024. It then spent the next three months in a controlled collapse, finding its final floor at $143 in early February 2026. That bottom aligned almost perfectly with the deep 0.618 Fibonacci extension from the entire prior bull cycle. The bounce from $143 was explosive. Price ran from $143 to $377 territory in weeks, then pulled back into the $232 to $288 consolidation range, where it has been building structure ever since. That range is now breaking to the upside on both the 4H and the daily simultaneously. Why the daily close matters more than the 4H. On the 4H, the $288.1 break happened today. But on the daily, the candle is still forming. A daily close above $288.1 would be the first confirmed daily close above this Fibonacci level since the range formed in March. Daily closes carry more institutional weight than 4H closes. Fund managers and systematic traders set alerts on daily candles, not 4H candles. A confirmed daily close above $288 brings a completely different buyer profile into this trade. Volume on the 1D today is already sitting at 23.57K TAO, meaningfully above recent daily averages during the consolidation period. Volume confirming a breakout is the difference between a real move and a fakeout. The full picture across both timeframes. The 4H shows the breakout happening in real time. The 1D shows the context that makes this breakout significant. The 200-day MA at $272.4 is now acting as a rising floor below price, not overhead resistance. That structural shift happened quietly over the past two weeks as price grinded above it and held. This is the sequence that precedes sustained moves: - Floor set at major Fibonacci level ($143 and $232.8). - 200-day MA reclaimed and held. - Six weeks of higher lows inside the consolidation range. - Breakout above 0.382 resistance at $288.1 with volume confirmation. Every box is now checked. Levels that decide everything from here. $288.1 must hold as support on any daily retest. Lose this on a daily close, and the setup resets. $300 is the first psychological test above. Expect resistance and potential shakeout attempts here. $348.7 is the 0.618 retracement from the $143 to $377 full swing. That is the measured target if this breakout is real. It represents a 21% move from current price. $272.4 is the 200-day MA, and the last level the bulls cannot lose on a weekly close. The verdict. The daily chart on $TAO looks like an asset that spent three months letting weak hands exit, built a textbook Fibonacci base, reclaimed its 200-day MA, and is now attempting to break free from six weeks of consolidation, with volume behind it. This is not a meme rally. This is a structure. The people still waiting for confirmation at $340 will tell you they knew all along. You are reading this at $288.


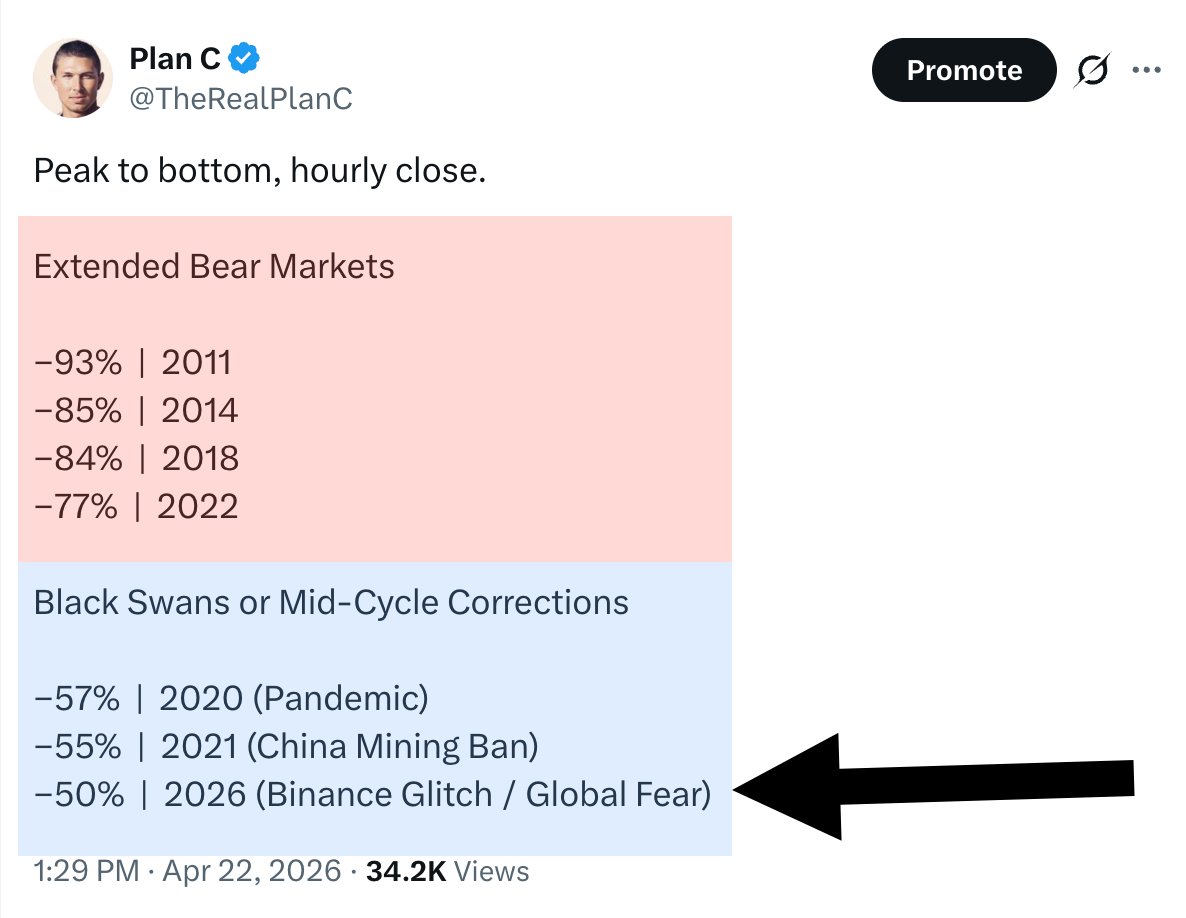
Well. Let’s see if I am wrong for the first time in 8 months. Sooner or later we will find out.


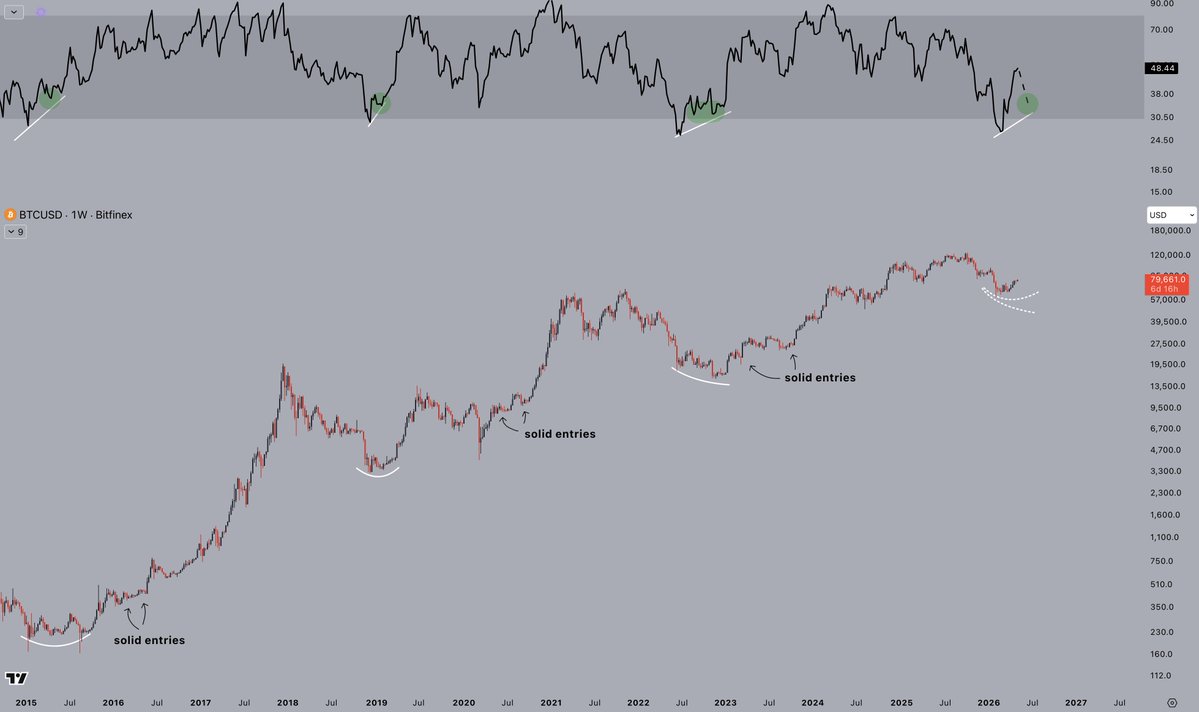
$USDT broke the trendline support this means $BTC to $83000 coming ?

The $TAO halving math is wild. First halving already happened. Half the supply is already issued. The remaining half will take exponentially longer to mine. Meanwhile, 2/3 of circulating supply is staked. Only a small fraction is actually liquid. Low supply + high lock-up + building demand = #bittensor is just getting started.