TM retweetledi
TM
14.2K posts


TM
@Tx9Mx
Enjoying life. Opinions are mine so please do your own due diligence as I don't give investment advice...
Texas, USA Katılım Kasım 2017
339 Takip Edilen395 Takipçiler
TM retweetledi

🚨 S&P 500 UPDATE
The 2025 manipulation was just a warning
But the current Phase III is the real deal
Market makers needed more liquidity this time
The trap is set and the retail FOMO is peaking
> Phase III: Final bull trap
> Phase IV: Massive flush loading
The fractal is now perfectly aligned
Be ready and turn notifs on!
Pepesso@0xPepesso
🚨 S&P 500 SETUP The market is repeating the 2025 playbook Look at the Roman numerals: Phase I: Local top Phase II: Initial drop Phase III: Dead cat bounce Phase IV: The final flush We are currently at Phase III... Next move DOWN Turn notifs ON!
English
TM retweetledi

Today is OpEx. All the puts below the red line expire worthless today with current spot

English
TM retweetledi

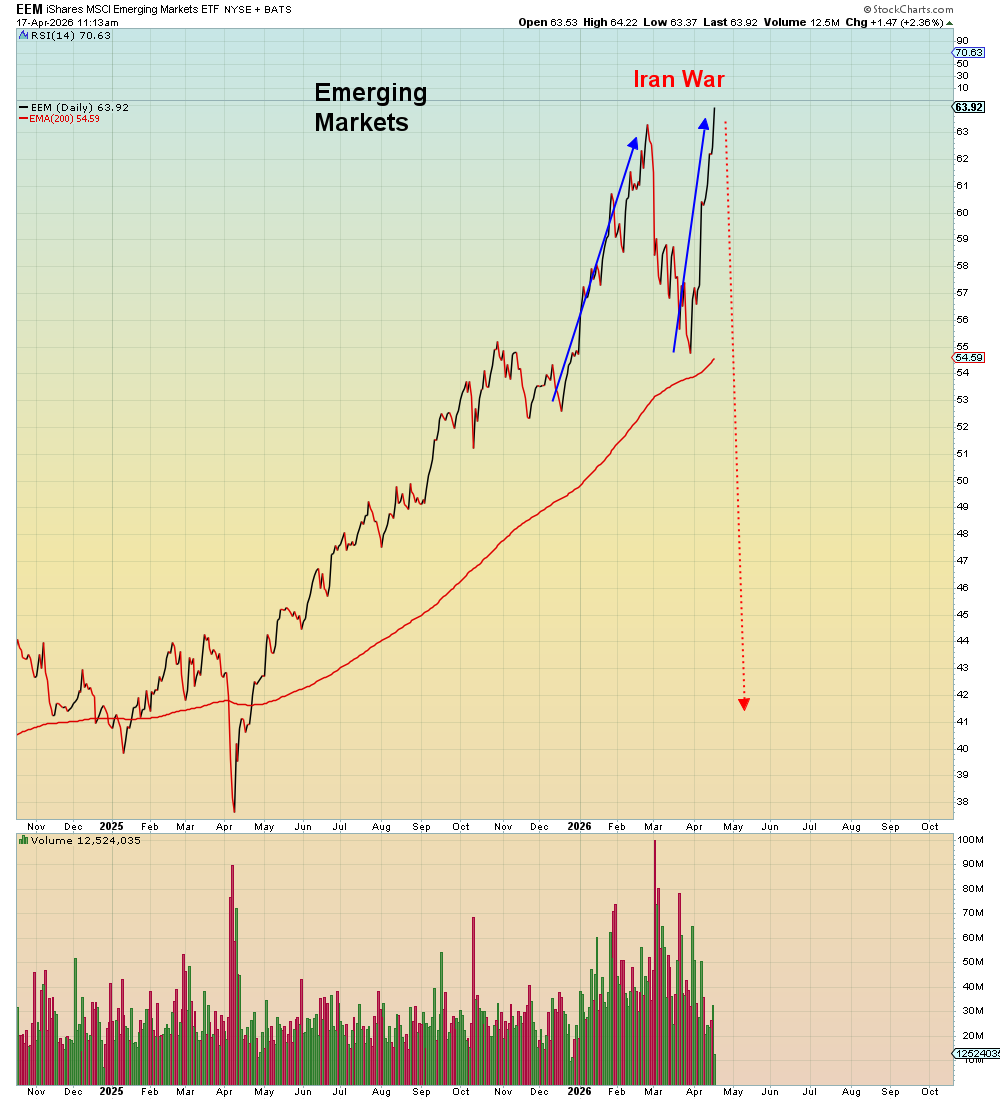
To recap, hedge funds were consensus long Emerging Markets when the war started. Then they got consensus monkey hammered when Hormuz was blocked. So they all got consensus short EMs which was the Wall Street call a few weeks ago.
And now they are getting consensus monkey hammered to the point that EMs are higher now than BEFORE the war started. Even though the IMF just downgraded EM growth THIS WEEK.
In other words, hedge funds are getting obliterated this year.
English
TM retweetledi

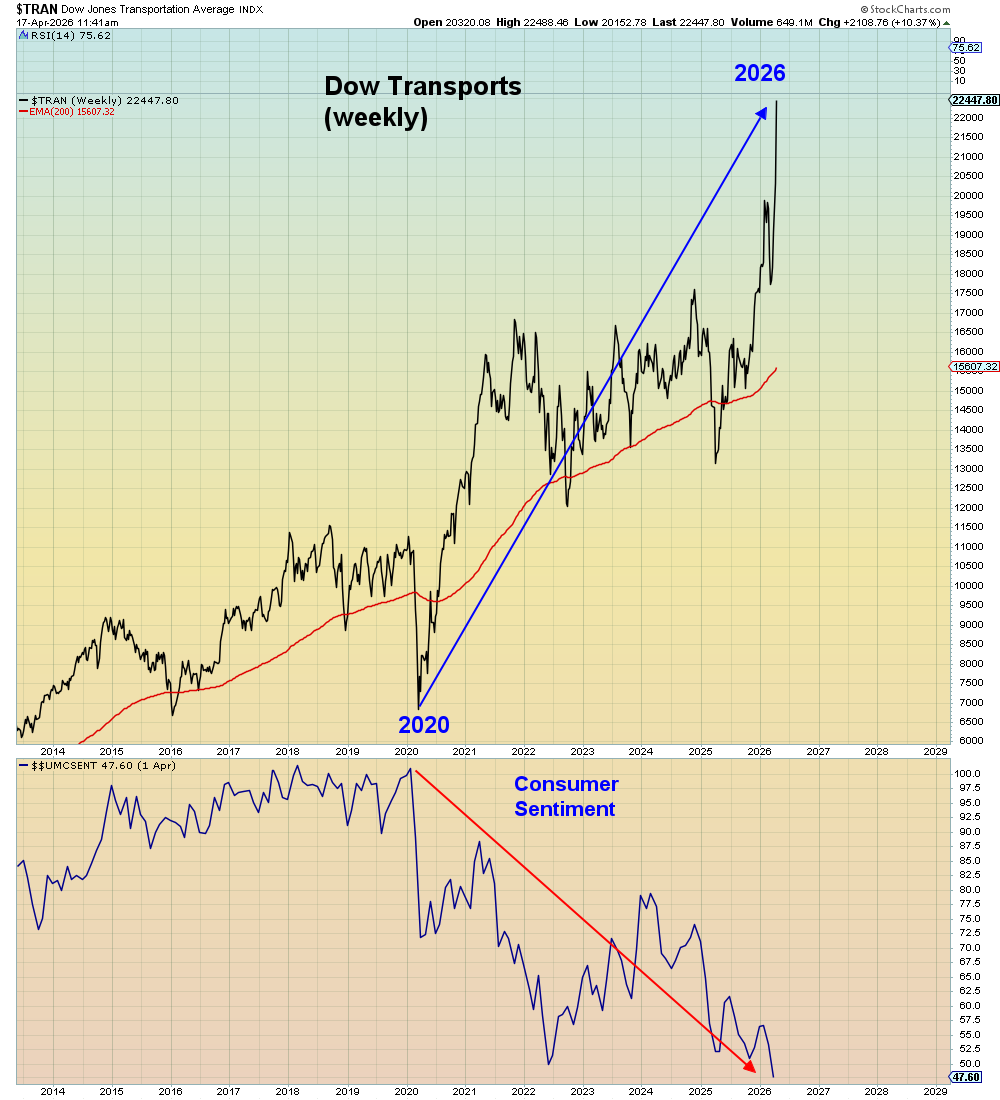
Today is the DAY.
April 17, 2026.
The intermediate top before the most difficult time of the presidential cycle.
THE BAD NEWS
We're entering the mid-term correction phase.
Historically, markets correct an average of 16% during this period.
It's the weakest part of the 4-year presidential cycle.
And it starts NOW.
THE CHART
SPX Seasonal Composite 4-Year Presidential Cycle (99 years of data):
Election Year → Post-Election Year → Mid-Election Year → Pre-Election Year
Red line (current cycle): Peaked April 17, 2026
Black line (historical average): Shows consistent mid-term weakness
The pattern is clear.
Mid-election years are brutal.
THE HISTORICAL PATTERN
Out of the last 20 presidential cycles, we've witnessed 19 sharp mid-term corrections.
Average decline: 16%
Timing: Mid-election year (Year 2 of the cycle)
This is where markets reset.
THE GOOD NEWS
After 19 out of 19 sharp mid-term corrections, we've seen a new bull market.
Duration: 2 years
Phase: Pre-election year + election year (Year 3 and Year 4)
This is the most bullish part of the cycle.
THE SETUP
We're at the top of Year 2.
The correction is coming.
But the 2-year bull market follows.
THE MESSAGE
Buy any dip in the coming months.
Not now. Not at the top.
But when the market corrects 10%, 15%, 20% — that's your entry.
Because history says: Mid-term corrections are buying opportunities for the pre-election rally.
THE PLAYBOOK
1. We're at the intermediate top (April 17, 2026)
2. Expect a 16% correction over the next 6-9 months
3. Layer in during weakness (-10%, -15%, -20%)
4. Hold through the pre-election year rally (Year 3)
5. Ride the election year momentum (Year 4)
THE PATTERN NEVER FAILS
19 out of 19 times, the mid-term correction was followed by a 2-year bull market.
That's 100%.
THE LESSON
Don't panic during the correction.
Don't fight the cycle.
Buy the dip. Hold for 2 years.
That's the presidential cycle playbook.
Today is the DAY.
The top is in.
The correction starts now.
The opportunity is coming.

English
@fabulouskid4u @DeItaone Hope you are right. Sadly, I think though that it will be back in full force as soon as the ceasefire deadline hits next week
English

*ARAGHCHI: PASSAGE FOR COMMERCIAL VESSELS OPEN THROUGH HORMUZ
English

TM retweetledi

Now, the question becomes whether this is a "sell the news" event...
English


@fabulouskid4u @DeItaone That's fair and I agree with this statement. Just frustrated with the madness we are witnessing real time. It's like a massive train wreck in slow motion...
English
TM retweetledi
@fabulouskid4u @DeItaone Really? To maybe open the SofH for a few hours when it was fully open just a few weeks ago? Clown
English

TM retweetledi

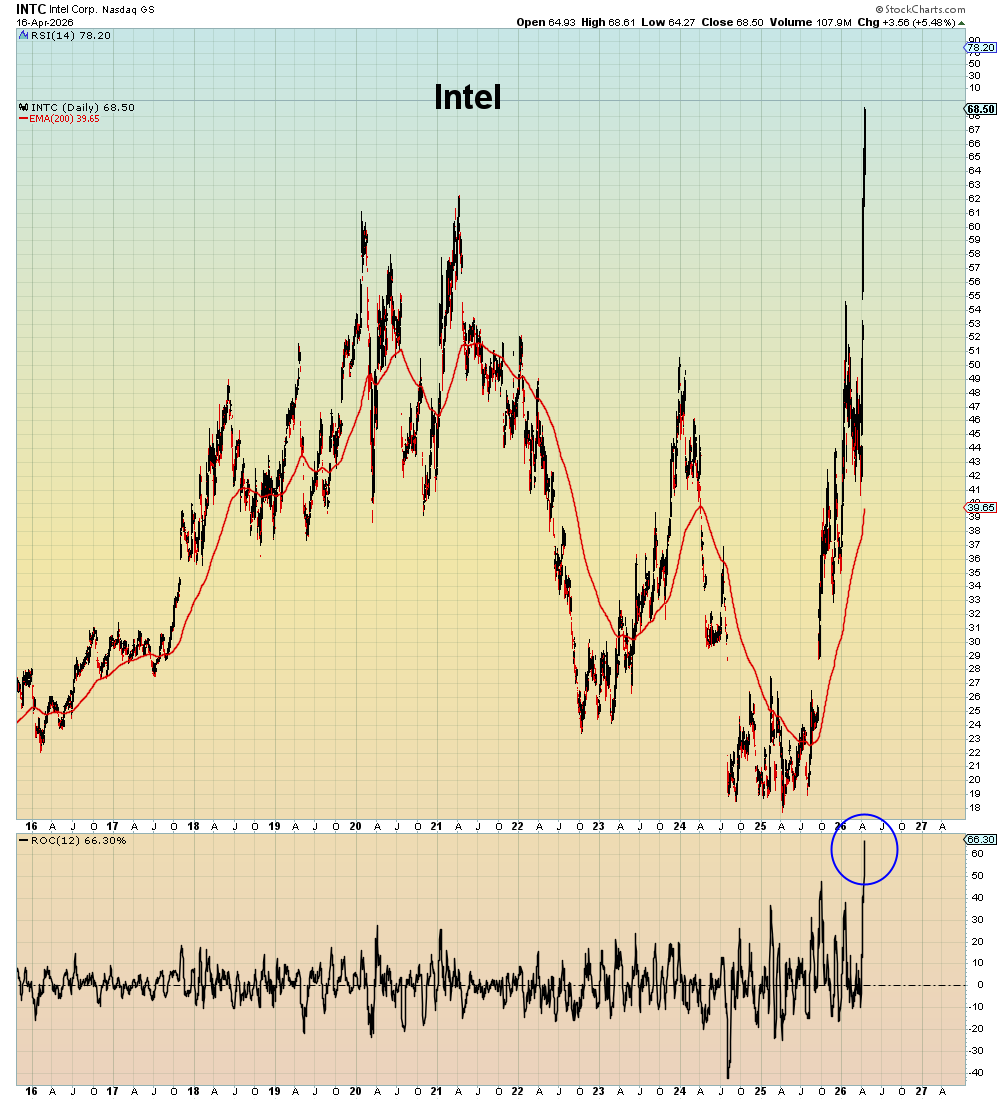
⚠️THIS IS ABSOLUTELY INSANE:
The Nasdaq 100 index has gone from oversold to OVERBOUGHT levels in just 2 weeks, measured by the Relative Strength Index (RSI).
This comes as the Nasdaq 100 has recorded 12 consecutive green sessions, the longest streak in 13 YEARS.
This is the 4th-longest stretch in the index’s history.
Over this period, the Nasdaq 100 has rallied +14.7%.
The market has rarely seen such an explosive short squeeze.

English
TM retweetledi

TM retweetledi

CNN confirms Donald Trump was forced to order Israel to halt its bombing of Hezbollah just to get Iran to the negotiating table. The Trump administration is relying entirely on Pakistani generals to save their disastrous diplomatic collapse. Total humiliation for Washington.
English
TM retweetledi

TM retweetledi

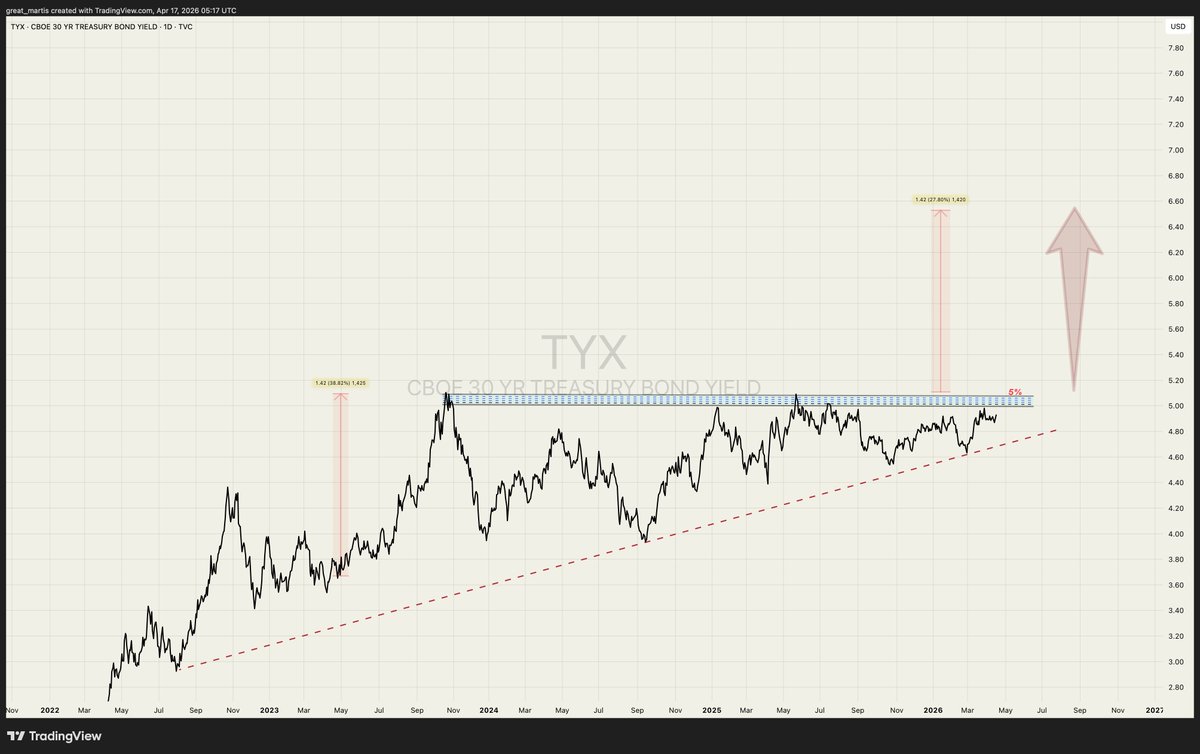
Ladies and gentlemens... dignitaries and distinguished market participants..
The 30-year Treasury bond is coiling.
Higher lows are in play, and an ascending triangle looks set to explode higher.
A move toward 5% is on approach ..its last line of defence.
Yours truly,
The Great Martis ✨
English

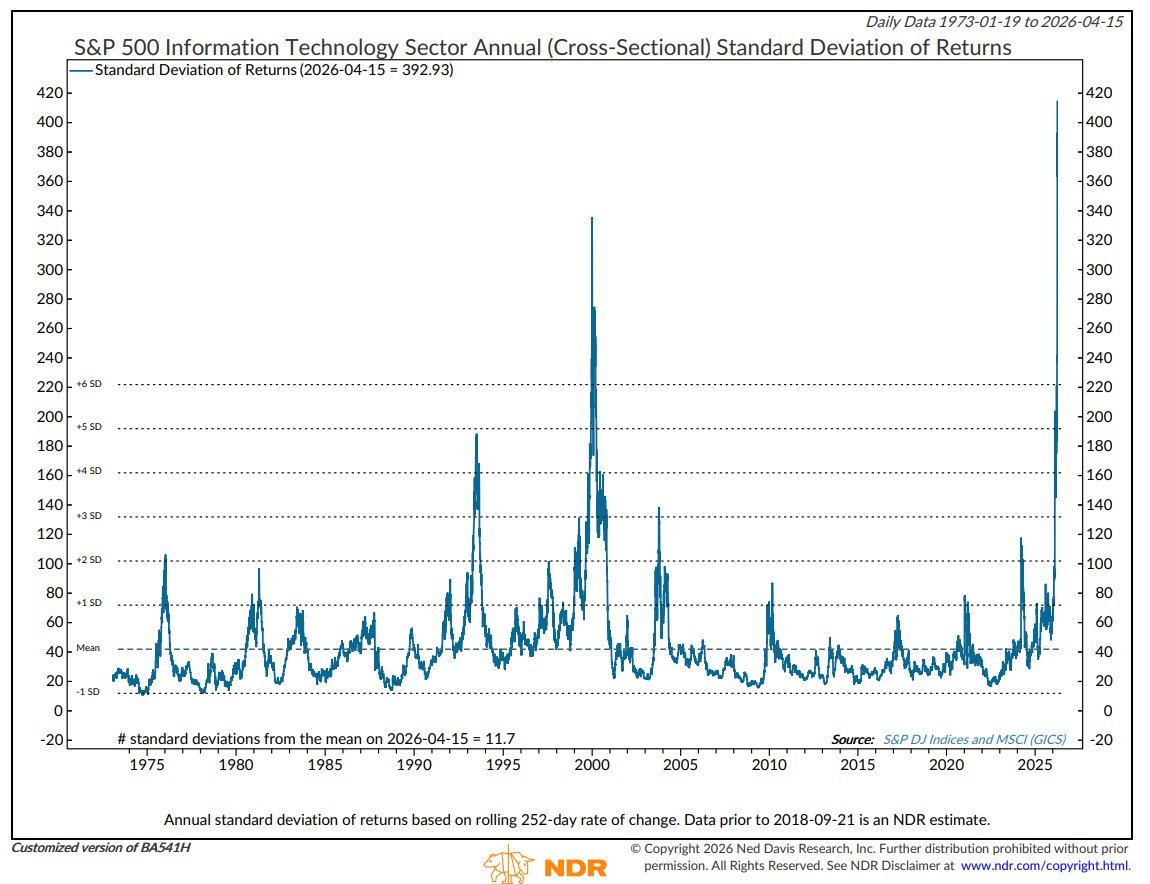
Have you guys ever experienced an 11.7 sigma event before?
Well you just did this week, exceeding the top of the dot-com bubble.
The cross-sectional standard deviation of annual returns within the S&P 500 Information Technology sector, as of April 15, 2026, dispersion hit 392.93, which sits 11.7 standard deviations above its long-term historical mean (data going back to 1973).
For context: The chart draws horizontal lines all the way up to +6 SD.
The current spike blows well past the +6 SD line.
English