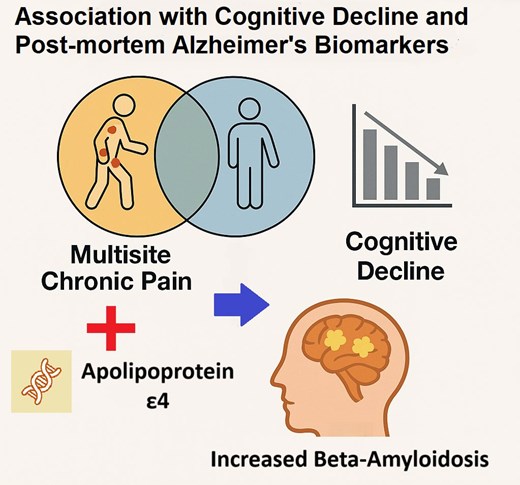
Dr. Tyler Bell

2.2K posts

Dr. Tyler Bell

Dr. Tyler Bell

@TylerBellPhD

Developmental Psychologist and Assistant Professor at UCSD. Tweets are mine and not official views of my institution or union. #LGBTQA #FirstGeneration #UAW

San Diego, CA Katılım Haziran 2019
3.6K Takip Edilen1.9K Takipçiler
Dr. Tyler Bell retweetledi
UCSF Fein Memory and Aging Center
Join us for the Fein Memory and Aging Center Lecture Series at UCSF. From Data to Knowledge: Integrating Clinical and Molecular Data with AI for Predictive Medicine Marina Sirota, PhD Professor, UCSF 📅 Monday, March 9 ⏰ 10–11 am PT 🖥️ Register: bit.ly/40jASZJ
UCSF Fein Memory and Aging Center tweet media
English
0
2
2
462
Dr. Tyler Bell retweetledi
UCSF Psychiatry and Behavioral Sciences
Our next Dept. of Psychiatry and Behavioral Sciences #GrandRounds – “Interpersonal Psychopharmacology: Prioritizing Life, Recovery, and the Relationship in the Care of the Person Experiencing Homelessness” with Anthony Carino, MD – is scheduled for next Tuesday, March 10, at 8:30am. To access the Zoom livestream, visit psychiatry.ucsf.edu/watchgrandroun…
UCSF Psychiatry and Behavioral Sciences tweet media
English
1
5
7
580
Dr. Tyler Bell retweetledi
UCSF Fein Memory and Aging Center
Edward and Pearl Fein Memory and Aging Center Grand Rounds 🧠 Is the ATN framework one-size-fits-all? Lessons from diverse populations 🎤 Ann D. Cohen, PhD, University of Pittsburgh 🗓 Monday, Feb. 23 | 10–11 a.m. 📍 Sandler Neurosciences Center, UCSF 👉 bit.ly/3ZWn3A4
UCSF Fein Memory and Aging Center tweet media
English
0
2
10
537
Dr. Tyler Bell retweetledi
ISTAART
ISTAART@ISTAART·
Next week! Hear global perspectives from Rachel Buckley at AAIC Neuroscience Next, Feb. 23–26. This hybrid event from @alzassociation is happening around the world and is a great way to engage the latest in dementia science! Register: alz.org/NeuroscienceNe… #AAICNeuro
ISTAART tweet media
English
0
3
7
704
Dr. Tyler Bell retweetledi
Pavan Chaggar
Pavan Chaggar@ChaggarPavan·
‼️ New preprint ‼️ How do amyloid-β (Aβ) and tau drive Alzheimer’s disease over time? We introduce a parsimonious, mechanism-based dynamical ATN (dATN) model to simulate longitudinal imaging biomarkers. A short thread 👇 Preprint: biorxiv.org/content/10.648…
BioFINDER@biofinder_study

New BioFINDER preprint! We formalise the Aβ–tau–neurodegeneration (ATN) framework into a mechanism-based model of AD, enabling us to simulate longitudinal imaging biomarkers and study how disease processes evolve and interact across the AD continuum. 🔗biorxiv.org/content/10.648…

English
1
4
8
697
Dr. Tyler Bell retweetledi
PURPOSE: the Pain Research Network
PURPOSE: the Pain Research Network@PainResearchers·
The next phase of NIH HEAL pain research is coming into focus. A new article series explores the HEAL Strategic Plan and Pain Research Priorities, with added context and insight for the pain research community. Read more: bit.ly/3MmzO3O #PainResearch #HEAL #NIH
PURPOSE: the Pain Research Network tweet media
English
0
1
2
102
Dr. Tyler Bell retweetledi
Olivier George
Olivier George@brainaddiction·
The new @NIH SciENcv Biosketch pissed me off so much today (lost 4 hours of my life) that I built a quick NIH Biosketch format converter. It lets you format each section while seeing both the preview and the HTML code at the same time. It restored my sanity, a little. Enjoy.
Olivier George tweet media
English
10
37
189
25.2K
Dr. Tyler Bell retweetledi
Denis Wirtz
Denis Wirtz@deniswirtz·
Download our large database of funding opportunities for early-career faculty and researchers Download it here: research.jhu.edu/rdt/funding-op… 433 funding opportunities.
Denis Wirtz tweet media
English
2
187
791
75.5K
Dr. Tyler Bell retweetledi
Joachim Schork
Joachim Schork@JoachimSchork·
Compare multiple statistical models effortlessly with ggstats, a versatile extension package for ggplot2 that simplifies data visualization tasks. The ggcoef_compare() function allows you to compare the coefficients of several models side by side, providing an intuitive way to analyze and present differences between them. Why use ggcoef_compare()? ✔️ Clear comparisons: Visualize the coefficients of multiple models in a single, cohesive plot to identify patterns and differences at a glance. ✔️ Customizable outputs: Adjust the appearance of the plot to meet your presentation or analysis needs. ✔️ Easy to use: Integrates seamlessly with ggplot2, making it straightforward to add model comparison capabilities to your workflow. The example visualization showcasing this functionality originates from the ggstats documentation and demonstrates how it can enhance your model comparison tasks: larmarange.github.io/ggstats/articl… Explore more ways to elevate your data visualization skills in R and learn about ggplot2 extensions in my online course, "Data Visualization in R Using ggplot2 & Friends!" More info: statisticsglobe.com/online-course-… #RStats #DataAnalytics #Rpackage #statisticians #DataViz #Data #tidyverse
Joachim Schork tweet media
English
0
18
115
5.4K
Dr. Tyler Bell retweetledi
Joachim Schork
Joachim Schork@JoachimSchork·
Missing data is a common issue in data analysis, and Little's MCAR test is a statistical method to determine if the missing values in a data set occur completely at random. Properly understanding the mechanism behind missing data is critical for ensuring accurate analyses and avoiding biased results. ✔️ If missing data is MCAR (Missing Completely at Random), the missingness does not depend on observed or unobserved data, simplifying analysis through techniques like listwise deletion or simple imputations without introducing bias. ❌ If the data is not MCAR, missingness may depend on observed data (MAR) or unobserved factors (MNAR). These situations require more advanced techniques such as multiple imputation, model-based approaches, or sensitivity analysis to preserve the validity of results. Misinterpreting these mechanisms can lead to inaccurate conclusions. The image compares MCAR, MAR, and MNAR mechanisms. In the MCAR panel, red points (missing data) are distributed randomly. In the MAR panel, missingness depends on observed data, with red points concentrated in specific regions of x1. The MNAR panel shows missingness depending on unobserved data, with red points related to y values. 🔹 In R, the naniar package offers the mcar_test function, which can be used to check the MCAR assumption and provides a simple output summarizing the test results. 🔹 In Python, the statsmodels library provides the test_mcar function, which calculates a p-value to determine whether the data set meets the MCAR assumption. Note: Little's MCAR test assumes that the data follows a multivariate normal distribution, as violations of this assumption can impact the reliability of the test results. The test also requires a sufficiently large sample size for the chi-square approximation to be valid, as small data sets may lead to misleading conclusions. Furthermore, Little's MCAR test is designed only to determine if the data is not MCAR. While Little’s MCAR test is commonly used, alternative methods can bypass its limitations. An alternative is logistic regression, modeling missingness as the response and using the Likelihood Ratio Test (LRT) to assess predictors, including potential interactions. Non-parametric tests like Kruskal-Wallis (for numerical variables) and Fisher-Freeman-Halton (for categorical variables) can also detect associations between missingness and observed data without requiring normality assumptions. Unfortunately, none of these methods can differentiate between MAR and MNAR, as statistical tests cannot confirm MNAR without making untestable assumptions about the missing data mechanism. Interested in a clear overview of missing data solutions? My online course Missing Data Imputation in R starts December 1, 2025. Take a look here for more details: statisticsglobe.com/online-course-… #database #Rpackage #RStats #datastructure #Statistical #statisticians
Joachim Schork tweet media
English
1
9
51
2.1K
Dr. Tyler Bell retweetledi
Joachim Schork
Joachim Schork@JoachimSchork·
Did you know that random forests are useful not only for prediction and classification, but also for imputing missing data? They can model complex, nonlinear relationships that many traditional methods fail to capture. The plot below shows how well random forest imputation preserves the structure of the observed values. Instead of relying on a single regression line, the model combines information from many decision trees. This allows it to capture interactions and patterns that simpler approaches often miss. As a result, the imputed values stay close to the real distribution and reflect the underlying data more accurately. If you want to learn how to apply random forest imputation and other missing data techniques in practice, my online course on Missing Data Imputation in R starts on December 1, 2025. Check out this link for more details: statisticsglobe.com/online-course-… #DataScientist #RStudio #VisualAnalytics #RStats
Joachim Schork tweet media
English
6
41
230
8.7K
Dr. Tyler Bell retweetledi
Joachim Schork
Joachim Schork@JoachimSchork·
When it comes to missing data imputation, predictive mean matching is often considered the go-to method. However, I recently came across an imputation approach I hadn’t seen before: NNS imputation from the NNS R package. After some testing, it seems to deliver results just as strong as predictive mean matching. How NNS imputation works: 🔹 Applies nonparametric nonlinear smoothing to identify structure in the data 🔹 Matches values based on observed patterns without relying on strict distributional assumptions 🔹 Flexible and well-suited for nonlinear and heteroscedastic settings The image below compares stochastic regression imputation, predictive mean matching, and NNS imputation on heteroscedastic data. Regression imputation clearly fails to capture the true data structure, while predictive mean matching and NNS imputation both preserve the shape well. I’d be interested in your thoughts. Have you already tried NNS imputation in practice? Do you think it could be a real competitor to predictive mean matching? Thanks to Fred Viole for creating this great package, for the insightful exchange about it, and for providing the R code for the NNS imputation shown in the image below! Check out the NNS R package here: cran.r-project.org/web/packages/N… Looking for guidance on best practices for missing data? My online course Missing Data Imputation in R begins December 1, 2025. More info: statisticsglobe.com/online-course-… #statisticsclass #R4DS #RStats #Rpackage #Data
Joachim Schork tweet media
English
2
24
156
6.5K
Dr. Tyler Bell retweetledi
Joachim Schork
Joachim Schork@JoachimSchork·
If you're still using raw R outputs for presentations, it's time for an upgrade! Tools like gtsummary bring your statistical results to life, making them much more digestible for non-technical audiences. While base R functions like summary(fit) work well for statisticians, they can be too complex for stakeholders who aren’t familiar with the detailed output. The tbl_regression() function from gtsummary makes it easy to present regression results clearly. In addition, gtsummary is highly versatile - it’s not just limited to linear regression. You can apply it to generalized linear models, survival analyses, and more. The package even allows you to include p-values, confidence intervals, and other important statistics directly within the tables, helping you to better communicate statistical results. Here are a few standout benefits: ✅ Simplified output that’s easier for stakeholders to understand ✅ Works seamlessly with a variety of models ✅ Customizable tables with key statistics like p-values, confidence intervals, and more The visualization included here was originally shared in a post by Dr. Alexander Krannich. Thanks to Alexander for inspiring me to create this post. Interested in more tips on data science, statistics, Python, and R? Be sure to sign up for my free email newsletter! Check out this link for more details: eepurl.com/gH6myT #Rpackage #DataScientist #datastructure #RStats #Statistical #Python #database
Joachim Schork tweet media
English
4
63
450
17.5K
Dr. Tyler Bell retweetledi
Joachim Schork
Joachim Schork@JoachimSchork·
Want to bring your plots to life? gganimate is a powerful extension for ggplot2 in R that transforms static visualizations into dynamic animations. It makes it easier to highlight changes and trends over time in a clear and engaging way. The attached animated visualization, which I created with gganimate, shows inflation trends for six countries since 1980. I think it’s great how the animation moves year by year, with a year counter at the top showing the current year, making it easy to track how inflation changed for each country over time. If you want to learn how to create animations like this, join my online course, Data Visualization in R Using ggplot2 & Friends. I’ll guide you through the steps to make visualizations like this and more! More information: statisticsglobe.com/online-course-… #ggplot2 #RStats #statisticsclass #VisualAnalytics #datavis #datascienceeducation #tidyverse #Rpackage #Python
GIF
English
1
7
44
2.5K
Dr. Tyler Bell retweetledi
Joachim Schork
Joachim Schork@JoachimSchork·
Transforming raw regression results into polished, publication-ready tables is effortless with the gtsummary package in R. The tbl_regression() function converts regression model outputs into clean, well-organized tables that showcase key statistics like estimates, confidence intervals, and p-values—making it ideal for reports, manuscripts, or presentations. ✔️ Streamlines Reporting: Automatically generates clear and professional tables from model outputs. ✔️ Customizable: Offers flexible options for labels, decimal places, and significance markers. ✔️ Supports Multiple Models: Works seamlessly with linear, logistic, Cox proportional hazards, and other regression models. The visualization below demonstrates how tbl_regression() formats regression results for easy interpretation, highlighting its ability to present complex information clearly. The visualization is taken from the official package website: danieldsjoberg.com/gtsummary/arti… Looking for more insights on Statistics, Data Science, R, and Python? Subscribe to my email newsletter! Check out this link for more details: eepurl.com/gH6myT #statisticians #datascienceenthusiast #Python #RStats
GIF
English
1
21
151
5.7K
Dr. Tyler Bell retweetledi
Caroline Swords
Caroline Swords@CarolineSwords4·
Please retweet for PhD applicants: Duke University's Department of Psychology and Neuroscience is hosting their 6th Annual virtual office hours. Those interested will receive free, individualized feedback on CVs & statements between Nov 6th - 17th: docs.google.com/forms/d/e/1FAI…
English
1
27
21
2.2K