The Catalyst Decoder

1.7K posts

The Catalyst Decoder banner
The Catalyst Decoder

The Catalyst Decoder

@YourShami

Delta Hunter | Catalysts & Smart Money (US + India) | Price × Fundamentals | Volume Reveals | IT in Manufacturing |Tweets for learning

Germany Katılım Ekim 2021
337 Takip Edilen6K Takipçiler
Sabitlenmiş Tweet
The Catalyst Decoder
The Catalyst Decoder@YourShami·
**𝐅𝐢𝐧𝐝 𝐌𝐮𝐥𝐭𝐢𝐛𝐚𝐠𝐠𝐞𝐫𝐬 𝐰𝐢𝐭𝐡 𝐌𝐨𝐧𝐭𝐡𝐥𝐲 𝐑𝐒𝐈 𝐬𝐭𝐫𝐚𝐭𝐞𝐠𝐲 ** How do you identify and hold stocks during a bull market to build multibaggers in your portfolio? What gives you the confidence to stay invested in a stock? Let’s explore this using the monthly RSI. I have backtested data from the previous bull market and found a common pattern among all the multibagger stocks. The investors who held these stocks in their portfolios noticed that they turned into multibaggers when a specific condition was met. 
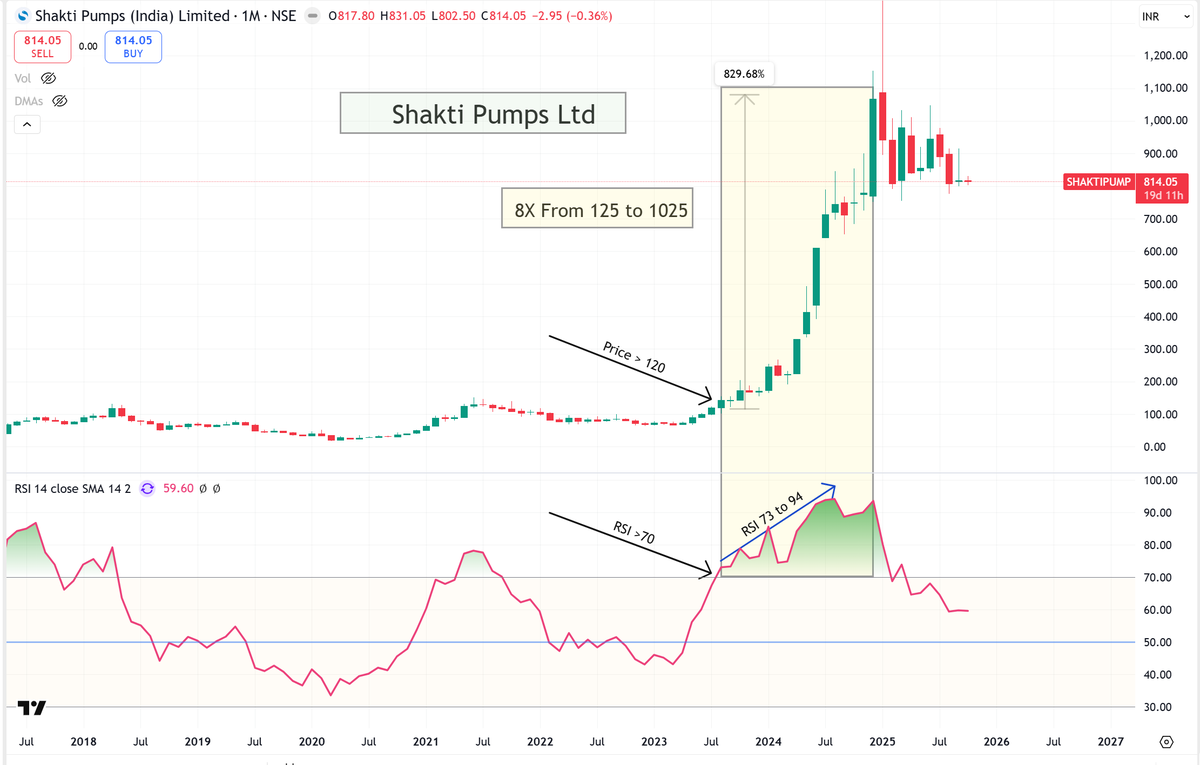
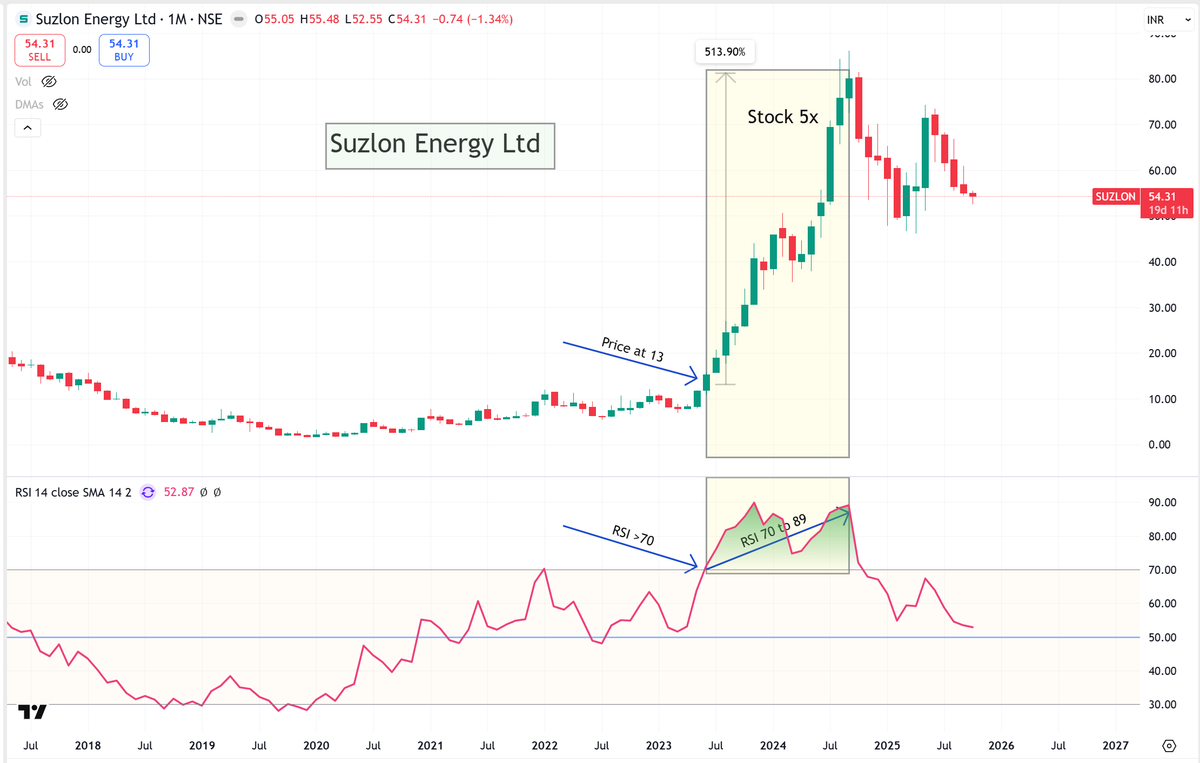
It’s actually quite simple — when the monthly RSI stays above 70, it clearly indicates a strong uptrend and shows the stock’s potential to become a multibagger. I have tested this pattern across multiple stocks and observed the same consistent results. Now, let’s look at some examples below where you’ll notice this same pattern. You can even backtest it yourself — you’ll likely find similar situations. 
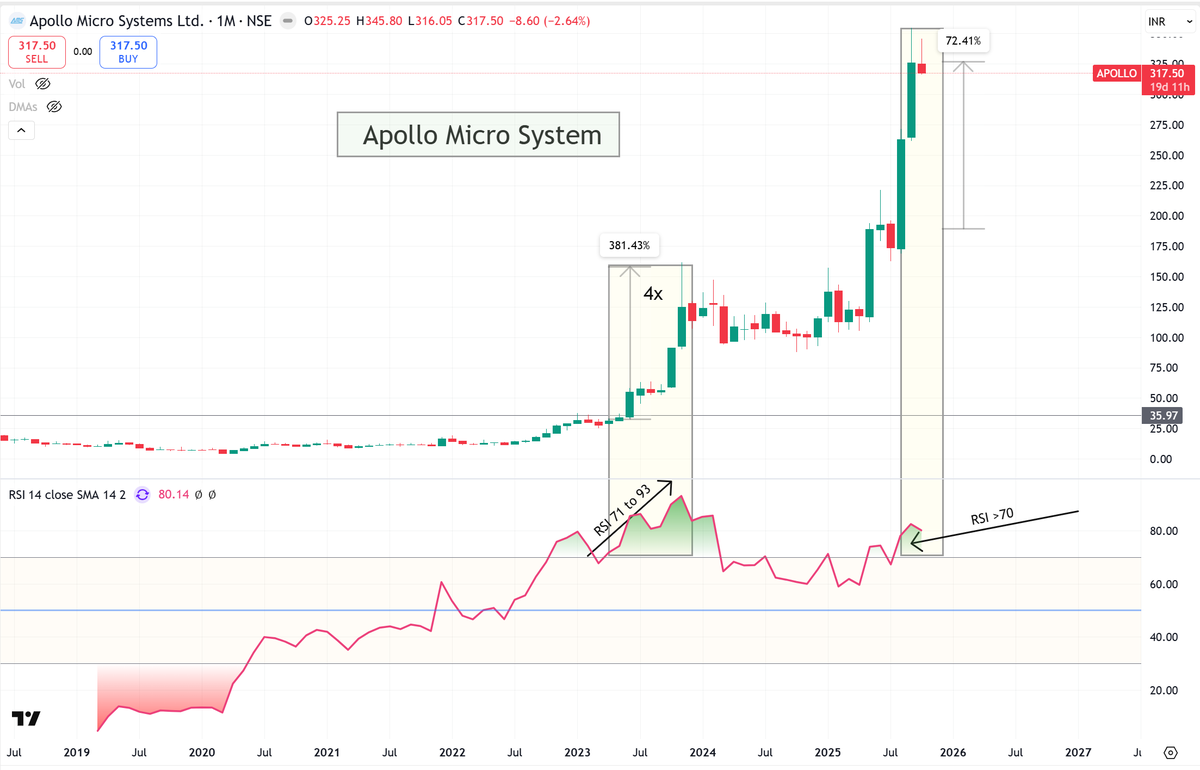
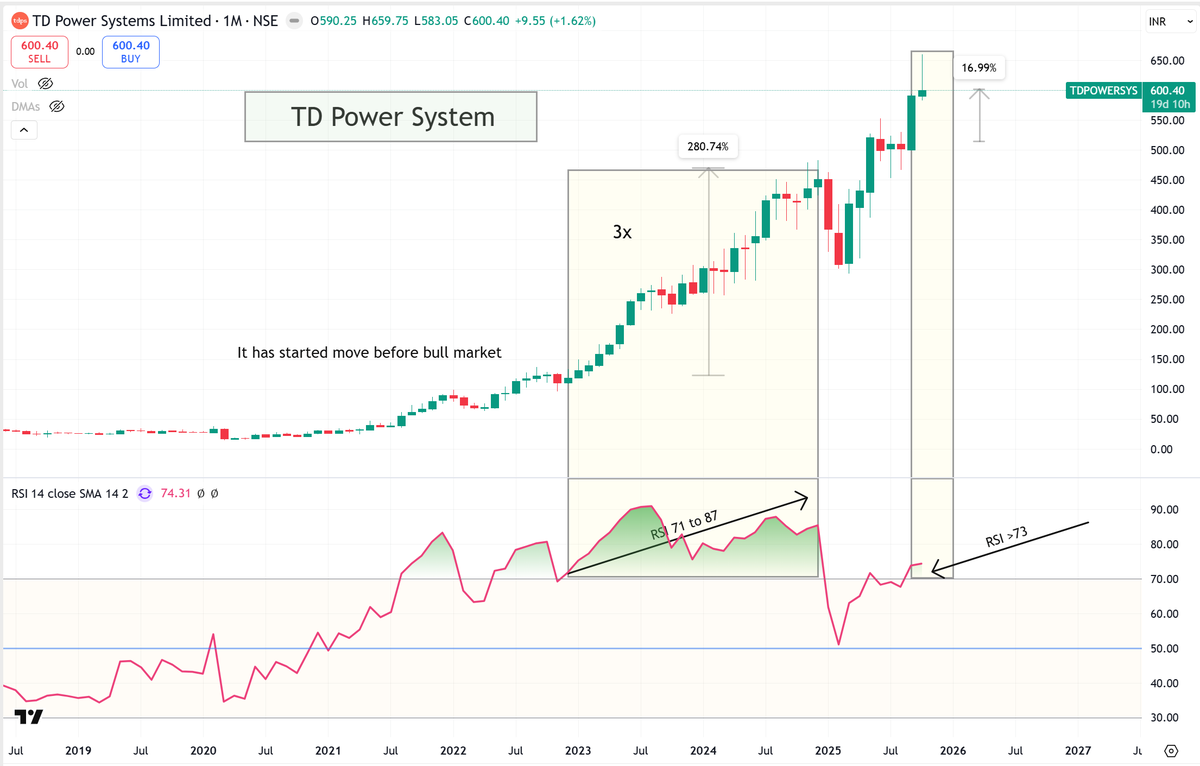
In my backtests, I’ve observed that when the monthly RSI rises from 70 to around 85, the stock price often doubles within a few candles. When the RSI further climbs to 93–94, the stock typically becomes a 4x to 7x multibagger. Of course, this move takes a few months, but with careful observation of chart patterns and sector strength, you can gain the confidence to stay invested and capture the full potential of the rally. These patterns work effectively during a bull market. Now, the question is — how do you identify a bull market? It’s actually quite simple. If the percentage of stocks trading below their 40W / 200 DMA moving average is less than 30%, it usually indicates that you are in a bull market. Once you confirm that, the next step is to find the right sector leading the rally ( Ex: Power Sector ), and within that sector, identify the right stocks. When a stock’s monthly RSI crosses above 70, you’ll often see live examples of strong momentum and potential multibaggers forming right in front of you. This insight can help you prepare for the next bull market and identify which stocks to hold in your portfolio for potential multibagger returns. One important point to remember — this method is only for riding the stock, not for deciding your exit. For exits, you should always follow a separate strategy that suits your trading or investment plan Shakti Pumps and Suzlon were part of my backtested examples, while Apollo and TD Power are currently showing similar setups — with their monthly RSI > 70. One important point — you can set an alert in TradingView for when the monthly RSI crosses 70. Once it happens, TradingView will notify you automatically, making it easier to track potential breakout stocks in real time.
The Catalyst Decoder tweet mediaThe Catalyst Decoder tweet mediaThe Catalyst Decoder tweet mediaThe Catalyst Decoder tweet media
English
28
82
440
75.7K
The Catalyst Decoder
The Catalyst Decoder@YourShami·
Your subscribers are definitely getting the benefit. The updates you share and the speed at which you share them matter a lot in the market. Fast and quality information always gets precedence in stock markets. @LearningEleven "Hero or Zero" thoda DM kardo 🤪 #swingtrading #positionaltrading
English
0
0
6
3K
Sekhar
Sekhar@LearningEleven·
i) How TD Power is shaping up for FY27 & FY28 ii) The Sakar Healthcare gold rush iii) My latest views on Shree Ganesh Remedies and RBZ Jewellers iv) The swinging Sai Life Sciences v) And finally, the “hero or zero” bet that I am disclosing for the first time All these answered in "On the Ground" edition today!
English
9
25
328
34.2K
The Catalyst Decoder
The Catalyst Decoder@YourShami·
This is not Price to Earnings anymore, this is Price Explosion (PE) case. Hint: Discover the forward PE, then you will come to know the story .
English
0
0
0
36
The Catalyst Decoder
The Catalyst Decoder@YourShami·
#DMCC Margins were not as good as expected. Result bet . So exiting.
The Catalyst Decoder tweet media
The Catalyst Decoder@YourShami

DMCC Speciality Chemicals Ltd #DMCC Yes, most of them guess correct. The Story of "Sulfuric Acid (H₂SO₄)" This company operates in two segments: specialty chemicals and bulk chemicals. Under the bulk chemicals segment, sulfuric acid contributes the major share. Sulfuric acid alone contributes around 35–40% of the business, and the interesting part is that the company sells its products in the open market. If you observe the trend, whenever sulfuric acid prices peak, the stock price also tends to make new highs. It looks like that cycle is now starting to play out again. Currently, sulfuric acid prices are trading near all-time highs, up around 22% on a quarter-on-quarter basis and more than 40% year-on-year on average. Disc: Info for edu.

English
2
0
23
3.1K
The Catalyst Decoder
The Catalyst Decoder@YourShami·
#JSLL Jeena Sikho Lifecare Ltd.
The Catalyst Decoder@YourShami

#JSLL 1) TradingView has incorrectly shown the earnings date as 15th May, but the company has not officially announced the result date yet. Because of this, traders might have closed their positions prematurely. This is one possible scenario. 2) Park Medi World Ltd has opened a 350-bed hospital in Panchkula, Haryana and there are discussions circulating on the internet that this may have impacted JSLL’s business. ? Lets De-Code this ? Park Medi World Ltd is "Modern multi-specialty hospital" whereas JSLL "Integrative / Ayurveda + lifestyle care" About Panchkula, Haryana - is not primary revenue zone of JSLL. Lets understand , JSLL revenue chin. a) Flagship Hospitals : Large HIIMS hospitals (e.g., Meerut, NCR large units) : 55-70% revenue generated zones. b)Mid-size Hospitals : 50–150 bed HIIMS hospitals (e.g., Panchkula, Jaipur, Lucknow) : 25-30% revenue. c)Clinics / OPD Centres: Shuddhi/HIIMS clinics, therapy centres : 10-15% revenue. From these two angles, I do not see any major negativity explaining the stock’s fall. So far, I have not been able to identify any other reasons. That’s my overall view for now. Still holding.

English
0
1
19
3.4K
The Catalyst Decoder
The Catalyst Decoder@YourShami·
#JSLL 1) TradingView has incorrectly shown the earnings date as 15th May, but the company has not officially announced the result date yet. Because of this, traders might have closed their positions prematurely. This is one possible scenario. 2) Park Medi World Ltd has opened a 350-bed hospital in Panchkula, Haryana and there are discussions circulating on the internet that this may have impacted JSLL’s business. ? Lets De-Code this ? Park Medi World Ltd is "Modern multi-specialty hospital" whereas JSLL "Integrative / Ayurveda + lifestyle care" About Panchkula, Haryana - is not primary revenue zone of JSLL. Lets understand , JSLL revenue chin. a) Flagship Hospitals : Large HIIMS hospitals (e.g., Meerut, NCR large units) : 55-70% revenue generated zones. b)Mid-size Hospitals : 50–150 bed HIIMS hospitals (e.g., Panchkula, Jaipur, Lucknow) : 25-30% revenue. c)Clinics / OPD Centres: Shuddhi/HIIMS clinics, therapy centres : 10-15% revenue. From these two angles, I do not see any major negativity explaining the stock’s fall. So far, I have not been able to identify any other reasons. That’s my overall view for now. Still holding.
English
1
1
7
4.1K
TrendSpy
TrendSpy@TrendSensor·
@YourShami Sir, Any idea. Why this stock falling in last two sessions??
English
1
0
1
198
The Catalyst Decoder
The Catalyst Decoder@YourShami·
Jeena Sikho Lifecare Ltd #JSLL FY26 PAT is greater than the revenue from FY23 , and this trend is expected to continue for the next two years as well. FY23 : Revenue : 204cr ---> FY26E PAT : 225 Cr FY24 : Revenue : 324cr ---> FY27E PAT : 330 Cr FY25 : Revenue : 469cr ---> FY28E PAT : 480 Cr
The Catalyst Decoder tweet media
The Catalyst Decoder@YourShami

Jeena Sikho Lifecare Ltd #JSLL What the market is missing ? ① OTC Optionality — Under-modelled Street expectations are already moving towards ~250 Cr. OTC potential by FY28, but the actual optionality can be significantly larger. The company has rapidly expanded distribution, entered new topical OTC categories, and is building a portfolio with structurally better margins compared to prescription products. If execution continues at the current pace, OTC itself can become a major standalone value creator over the next few years. ━━━━━━━━━━━━━━ ② Capital-Light Diagnostics #Chandan_Diagnostics The diagnostics business has the potential to create a ~50 Cr. annual revenue stream with almost zero incremental capex. Since the ecosystem, lab partnerships, and collection infrastructure are already in place, scaling becomes highly efficient from here. This is the kind of expansion that improves operating leverage without putting pressure on the balance sheet. ━━━━━━━━━━━━━━ ③ Insurance Tailwind — Silent Re-rating Trigger A structural shift is happening in reimbursement behaviour. Treatments and day-care procedures that were previously ignored are now increasingly getting insurance acceptance. This improves affordability for patients, increases treatment continuity, and can meaningfully improve demand visibility. Markets are still underestimating how powerful this change can become over time. ━━━━━━━━━━━━━━ ④ Governance Upgrade Statutory auditor Walker Chandiok (GT, Big 5), internal auditor Forvis Mazars (World #7), ERP migrated to Oracle, CRM live on Salesforce. In a sector rife with unorganised family-run clinics, this is a material re-rating trigger as institutional allocators have historically discounted the category. ━━━━━━━━━━━━━━ ⑤ UAE Insurance Expansion The company’s positioning in UAE creates access to a premium-paying patient base with better realization and higher ARPU. Insurance-backed acceptance of alternative medicine is improving steadily, which opens a much larger monetisation opportunity. This international optionality is still not fully reflected in market expectations. Some Key Triggers: ① Entero distribution partnership. Exclusive Ayurveda distribution tie-up with Entero Healthcare (Jan 2026). Opens up 1.25 lakh chemist network nationwide. Instant national footprint that would have cost JSLL 5 years and ₹200 Cr+ to build. Revenue potential: ₹150-300 Cr in FY27 if even 20% of 16 SKUs achieve meaningful retail velocity. Entero's track record with Emami and similar brands is the sanity check. ② Bed capacity scale-up to 5,800. Current: 2,850 built / 2,290 operational. Target: 5,800 beds by FY28 across owned + franchisee + college-partnership models. Capex-light (₹34 lakh/bed vs allopathy's ₹70L-1Cr). If mature-cohort occupancy of 80% holds, 5,800 beds at ₹8,500 ARPOB generates ~₹1,440 Cr service revenue alone — 10x current. Plus medicine cross-sell follows proportionately. Disc: Info for educations. @manikanth2304 @LearningEleven if you are also tracking this company, please share the key points of your thesis in case I have missed anything here.

English
7
8
84
8.7K
Suresh K
Suresh K@SureshKBN·
The real issue is many fund managers and RAs spend more time calling high valuation momentum stocks expensive than explaining why their own “reasonable valuation” stocks are not performing.
English
8
5
145
6.7K
The Catalyst Decoder retweetledi
Shashank Dogra
Shashank Dogra@Shashank1171·
Q4 FY26 has been the first impressive earnings print for #MTARTECH just like #STLTECH and #HFCL. A stock that once delivers is no longer a speculative bet and attracts a lot of institutions sitting on sidelines waiting for the numbers to match narrative. It might look extended because you bought it cheap but reality is a stock at each stage attracts a buyer of different risk and return profile.
English
3
3
93
7K
The Catalyst Decoder
The Catalyst Decoder@YourShami·
@waste_investor Whole year FY26.. margins guidance range 20-22%, but achieved 18%, if I'm not wrong. for Q4 11%, unexpected. Let's see tomorrow's reaction.
English
0
1
1
98
Ravi Singh
Ravi Singh@waste_investor·
@YourShami During the last concall Management told that this quarter was exeception and should not be extrapolate. So in that context YoY should be the metric
English
1
0
2
71
The Catalyst Decoder
The Catalyst Decoder@YourShami·
$USDINR = 95.6 It is time for portfolio reconstruction. Exports remain the key theme, with DC proxies, CDMOs, and other export-oriented businesses seeing increased allocation in portfolios.
English
0
0
27
1.6K
CompoundingAI
CompoundingAI@compoundingaiin·
Rightly pointed out, our post actually captures this exact nuance. We've noted that the revenue miss is real but the context matters, and that management explicitly shifted focus to the ₹500 Cr EBITDA target around Q3, against that they delivered ₹544.5 Cr. So the scorecard in our post shows revenue as a miss against the original guidance they gave till Q2 FY26, but the post explains why that number stopped being the primary metric mid-year. Both things are true simultaneously and we think that's the honest way to track it. Fully agree on the PCB JV with Shinhyup, it is the big one to watch next.
English
1
0
1
174
CompoundingAI
CompoundingAI@compoundingaiin·
Stop scrolling, login to CompoundingAI now ! Syrma SGS Technology - Q4 FY26 Revenue missed guidance. Margins beat it by 170 bps. Management chose one over the other, deliberately. Q4 numbers Q4 revenue: ₹1,465 Cr, up 58.5% YoY and 15.9% QoQ, the strongest quarter of the year. PAT to owners: ₹101 Cr, up 54.6% YoY. Q4 ETR came in at 20.7% vs the guided 23–24%, giving a small boost to reported PAT. But Q4 EBITDA margin stepped back to 11.85%, down 48 bps YoY and 49 bps QoQ from Q3's 12.34%. The reason: cost of materials grew 88.9% YoY in Q4 against revenue growth of 58.5%. Higher material content in the mix, or a shift towards lower-margin orders in the quarter, management needs to clarify which. Why the full year revenue miss happened FY26 revenue: ₹4,819 Cr, up 27.3% YoY. Guidance was 30–35%. The miss is real but the context matters. Management has been explicit about reducing the share of low-margin consumer business and pushing Industrial, Automotive, and Healthcare. FY26 EBITDA margin: 11.2% vs guided <9.6%. Op. EBITDA: ₹544.5 Cr vs ₹500 Cr target. They sacrificed top-line to deliver bottom-line and it worked. Balance sheet transformation Net debt of ₹264 Cr in FY25 → net cash of ₹455 Cr in FY26. ₹1,000 Cr QIP raised and deployed: Elcome acquisition (₹235 Cr), debt repayment, and capex. CFO grew 64% YoY to ₹290 Cr. Trade receivables grew 24.6% vs revenue 27.3%, collections finally under control after being a persistent concern. Strategic moves executing Four parallel bets in FY26: Elcome (60% acquired), Elemaster JV (European EMS access), Shinhyup JV (PCB manufacturing), Germany facility commissioned. The global EMS ambition is being built but each of these carries execution risk in FY27. Guidance scorecard: Revenue growth 30–35% → 27.3% ❌ Op. EBITDA margin >9.6% → 11.3% ✅ EBITDA target ₹500 Cr → ₹544.5 Cr ✅ Working capital <65 days → ~50 days ✅ What to watch in FY27: Can revenue re-accelerate to 30%+ without giving back the 11%+ margin? Does the Q4 material cost spike persist into Q1? And does the Shinhyup PCB JV capex execute on time without balance sheet strain? Note : This is not an investment advise.
CompoundingAI tweet media
English
1
2
17
2.9K
tushar
tushar@tushar9590·
Name a X handle which actually helps you increasing your knowledge about markets 🙏
English
101
7
146
26.7K