Volcaholic 🌋@volcaholic1
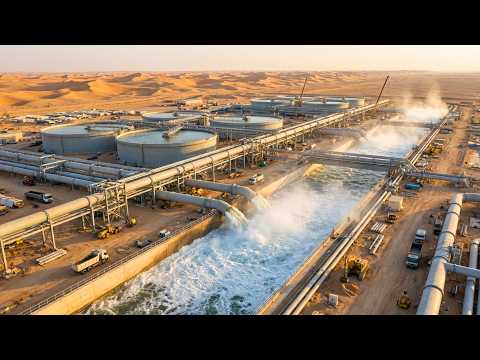
This is todays catastrophic flooding in Hubei, China, and climate change deniers are still opening their mouths.
The evidence is in front of us, yet some still choose to ignore it. It makes me sick.
Every climate denier, every oil-bought politician, every “it’s just natural cycles” clown who spent years obstructing action has blood on their hands.
These floods, the wildfires, the heatwaves, the droughts, that starve people to death - this is what deliberate obstruction looks like.
Your denial didn’t just slow things down. It made the body count higher. You’re not a sceptic. You’re an accomplice. You contributed to this. Own it or shut the fuck up.