@gehrenbergdfs The sims in respect of this event would appear to be severely impaired.
English
gyu
282 posts


💥Players Championship "Guy I'm Playing that You Shouldn't" PGA options and some info on them First up: Jordan L Smith 6.8k 🏴 Quietly playing some quality golf here as we used to see him over in Europe. Last few weeks solid Top 25 finishes and got some reps in FL. Next up ⤵️


I want to share a crucial update on our study, KETO-CTA. (The video for this article is in the next tweet) Our study recruited 100 participants, each undergoing two high-resolution heart scans, known as CT angiograms, one year apart. (For more background on this study design, see preprint in the following tweet) There are now four analyses of those same 200 scans. But one of those analyses stands out — and I have some new developments to report. For a quick background, the first quantitative analysis was from an AI company, Cleerly. We published their analysis of our scans last year. After the paper was published, the Citizen Science Foundation was free to look at the raw Cleerly data, and we found a number of patterns that appeared different from what is typically seen in other coronary plaque studies. For example, in Cleerly's analysis, not one of the participants showed lower plaque levels at follow-up — even though CTA scans typically show some natural variation in both directions, especially in people who start with very little plaque. For another example within their data, people with no detectable calcium in their scans appeared to have several times more plaque progression than those who already had some calcium present. This runs counter to what many in cardiology call the "power of zero" — the well-established finding that having no coronary calcium is typically associated with lower risk and slower disease progression. Another major development: shortly after publication, we learned that the scans Cleerly was analyzing were not fully blinded. In studies like this, the order of scans is typically kept unknown to the analyst to help prevent any potential for bias. But in this case, the chronological order was available in the scans. We therefore asked Cleerly to repeat their analysis using a properly blinded set of scans, which is standard practice in longitudinal studies. Cleerly declined to perform a blinded reanalysis. Because of this, we commissioned an additional, independent analysis from Heartflow. Heartflow has been a leader in this space and is the most extensively validated AI platform for coronary CTA analysis. The Heartflow analysis was conducted with full operational blinding and completed right before the prespecified third, and final quantitative analysis, which uses Medis QAngio. These two independent platforms were consistent with each other, yet both differed substantially from the Cleerly results. As these independent results became available, we shared them privately with Cleerly and again requested a blinded reanalysis of their original work. We offered to cover any costs involved just in case this was the barrier to reanalysis. Cleerly again declined. However, a new development emerged. Several participants requested their scans from the study and submitted them directly through their own, personal cardiologist. Any cardiologist with a proper Cleerly account can appropriately submit scans on their patient's behalf. So in a sense, our participants themselves were able to provide a portion of the blinded analysis we were originally requesting. This was then shared with me on behalf of the Citizen Science Foundation. In total, there are 19 of these individual submissions — about 10% of the total scans in our study so far. Individual Submissions vs. Study Data We focused on the 8 participants who have both a baseline and a follow-up individual submission of their scans (the other 3 submissions are unpaired). [Please Note: These data are preliminary] Figure 1 compares the change in soft plaque (Non-Calcified Plaque Volume or NCPV) reported by the original Cleerly study analysis against the results from each participant's individual submission. [See Figure 1] Of the 8 participants, four showed an increase in soft plaque in both datasets — but in three of those four cases, the individual submissions reported substantially less progression than the study data. The remaining four participants all showed progression in the study data, yet every one of their individual submissions showed a decrease — a complete reversal of direction. The largest discrepancy was a single participant whose study data reported an increase of 32 mm³, while their individual submission showed a decrease of 48 mm³ — a reversal of approximately 80 mm³. The median change in soft plaque for these 8 participants was +20.6 mm³ (a 31% increase) in the original study data, compared to just +0.7 mm³ (about a 2% increase) from their individual submissions (Figure 2). The mean average is even more pronounced: the study data shows an average increase of +20.9 mm³ (42% from baseline), while the individual submissions show an average decrease of 5.1 mm³ (an 8% decline). In other words, the study data says plaque went up; the individual submissions say it went down (Figure 3). Direction of Change Across Platforms To put these individual submissions in broader context, Figure 4 compares the direction of soft plaque change across three analyses of these same scans. On the left is the original Cleerly study analysis — 99 participants after excluding one who had a procedure between scans. 98% showed an increase in soft plaque. Only 2 showed no change. Zero showed regression. In the middle are the 8 individual submissions, split right down the middle: 50% showing progression and 50% showing regression. On the right is the full Heartflow analysis across 95 participants. While 8 is a small sample size, the direction-of-change in these individual submissions is far closer to the Heartflow analysis than the original Cleerly analysis. It is worth emphasizing: 4 out of the 8 participants — fully half — received individual submission results showing less plaque in their second scan than their first. But after accounting for the single exclusion mentioned above, not one of the 99 participants in the original Cleerly study analysis showed plaque regression. We are not sure what happened with the original Cleerly analysis. We just know the other analyses are largely consistent with each other — and now, that includes these individual submissions to Cleerly as well. Next Steps We have already taken steps regarding last year's paper that contained the original Cleerly analysis. We are working with the journal on that now, and we expect news on this very soon. In the meantime, the preprint of our current paper with both Heartflow and QAngio results is available at the link below. Importantly, the two principal findings reported in the original paper have been reproduced in both the Heartflow and QAngio analyses: (1) baseline plaque strongly predicts future plaque progression, and (2) ApoB was not associated with plaque progression I want to once again thank Dr. Budoff and the Lundquist team for providing these scans to study participants who request them. If you are a participant in our study and interested in sending in your scans through your cardiologist, we now have a budget to help cover the cost of that submission. You can contact us at info@citizensciencefoundation.org for more details. Thank you again to everyone for your support. 🙏 cc @nicknorwitz @AdrianSotoMota

I feel like I can breathe again! Get ready for a rant I've been waiting to let loose for a year. 🔥 First, here are the core facts about the Keto-CTA study to date: 🚨PART 1: THE FACTS 👉From its inception, Dave, Adrian, and I, being associated via the funding body (the Citizen Science Foundation), were blinded to certain elements of the data. The purpose was to protect the integrity of the project. 👉The profound irony is this also meant that, prior to publication, we couldn’t perform certain ‘checks’ and had to trust others to do so. Speaking for myself, it’s now painfully clear that was a mistake. 👉However, after the April 7th paper was published, "anomalies" (if I’m being polite) were noted with the Cleerly scans. 👉 Cleerly refused to redo the scans, despite multiple requests and being offered payment. 👉Importantly, and to my dismay, the original Cleerly reads were UNBLINDED, introducing a major source of bias. 👉At additional expensive, the scans were rerun through HeartFlow in a properly blinded analysis, and via the pre-specified QAngio methodology. 👉HeartFlow and QAngio agreed with each other and were discordant with the Cleerly analysis. 🚨PART 2: THE NEW NEWS What happened next was brilliant! And, truth be told, I only found out about it yesterday. For my own legal security – and at the recommendation of my friend and colleague who was taking the worst of it on the back end – there was a lot I didn’t know until this point. This is what happened… 👉Several participants independently submitted their scans to Cleerly as a workaround to obtain a truly blinded Cleerly analysis. 👉Those results were highly discordant with the original Cleerly analysis and aligned with the HeartFlow and QAngio analyses. The difference between the original Cleerly scans and the repeated blinded scans was massive! The original unblinded analysis reported a +20.9 mm³ mean increase in non-calcified plaque volume, while the blinded repeats showed a -5.1 mm³ mean decrease. I mean, MY GOODNESS!!! I basically did a backflip when I found out (@realDaveFeldman can release the footage of the meeting at his discretion) If you’ve been following the KETO-CTA story up to this point, the consistency of the findings across HeartFlow, QAngio, and now Cleerly itself (based on the blinded reads) should bring much-needed clarity. The converging results fundamentally reshape the narrative and directly refute the claim that the study demonstrates massive, unprecedented plaque progression in LMHR and near-LMHR And, after all that, the fact remains that every single analysis found no association between ApoB levels or LDL exposure and plaque progression. LET ME REPEAT: And, after all that, the fact remains that every single analysis found no association between ApoB levels or LDL exposure and plaque progression. 🚨 PART 3: NEXT STEPS In terms of next steps, I’ll quote my colleague Dave: “we have already taken steps regarding last year’s paper that contained the original Cleerly analysis.” I’ll leave it at that for now so I don’t overstep. But let me say, that’s the highly polished and diplomatic version. I certainly have stronger words about this process, but perhaps now is not the time. Where I will speak more plainly is in regard to the behavior of some detractors over the past several months. In a few cases, I’ve reached out privately to individuals who should know better, gently suggesting that, in light of the new evidence (Heartflow and QAngio), it might be time to reassess or lighten the abuse. For anyone sincerely paying attention—and for anyone with even modest insight into how scientific bureaucracy works—I hope it is now clear why we were not more forthcoming earlier in the process. 👉And trust me when I say, it’s never been harder to keep my mouth shut about anything in my life. I've accumulated more cortisol AUC in the last 11 months then in the entirety of my life to age 29. 🚨PART 4: SPEAKING FOR MYSELF Speaking for myself, I have been beyond frustrated and disappointed. At multiple stages, it has become painfully—and increasingly—clear to me that our scientific system, which presents itself as purely meritocratic, is far more political than most would imagine. These are difficult words for me to say as someone who comes from a family of doctors and scientists and who has spent his entire career in academic institutions—multiple Ivy League universities @Harvard @dartmouth, two doctorates, and top-ranked institutions in both England @UniofOxford and the United States. I was groomed in conventional academic medicine. If I have any bias, it’s to see the best in conventional medicine and modern scientific process. Most of my loved ones have made their living within this ecosystem. But when you pull back the curtain, the reality can be sobering. To those detractors who have verbally abused or personally attacked my colleagues and me—perhaps out of naivete or ignorance—I will say this plainly: it’s time to check yourselves. Too many people have spoken out of turn, seemingly to score points rather than to engage thoughtfully with an evolving scientific story—one that has been evolving for quite some time. When the HeartFlow and QAngio analyses were released, that alone should have prompted serious reflection. At minimum, it should have raised questions. The subsequent silence from some of the loudest critics, after they believed they had “won” a round, is telling. Science deserves better than scorekeeping. It deserves intellectual honesty and the humility to update one’s position when new evidence emerges. At times over the last year, the lack of curiosity, sincerity, and intellectual honesty from people who I tried to give the benefit of the doubt has made me want to vomit. And trust me when I say, this isn’t a victory lap. This is a promise. We are now over a hurdle that I have been waiting for almost a year. And frankly, I am ready to run headfirst through brick walls with my colleagues and friends by my side — those whom I trust to pursue the hard questions and the honest answers — and do so indefinitely using the tools and resources at our disposal, even when, and especially when, the scales are improperly tilted against us. Lucky for us, the intellectual environment is expanding — the black box of academia beginning to crack open. So someone hand me a crowbar, because I’m committing myself fully and completely, over the coming years and decades, to prying it wide open. Not gently. Not quietly. But decisively. My final words of this verbose dissertation? LFG

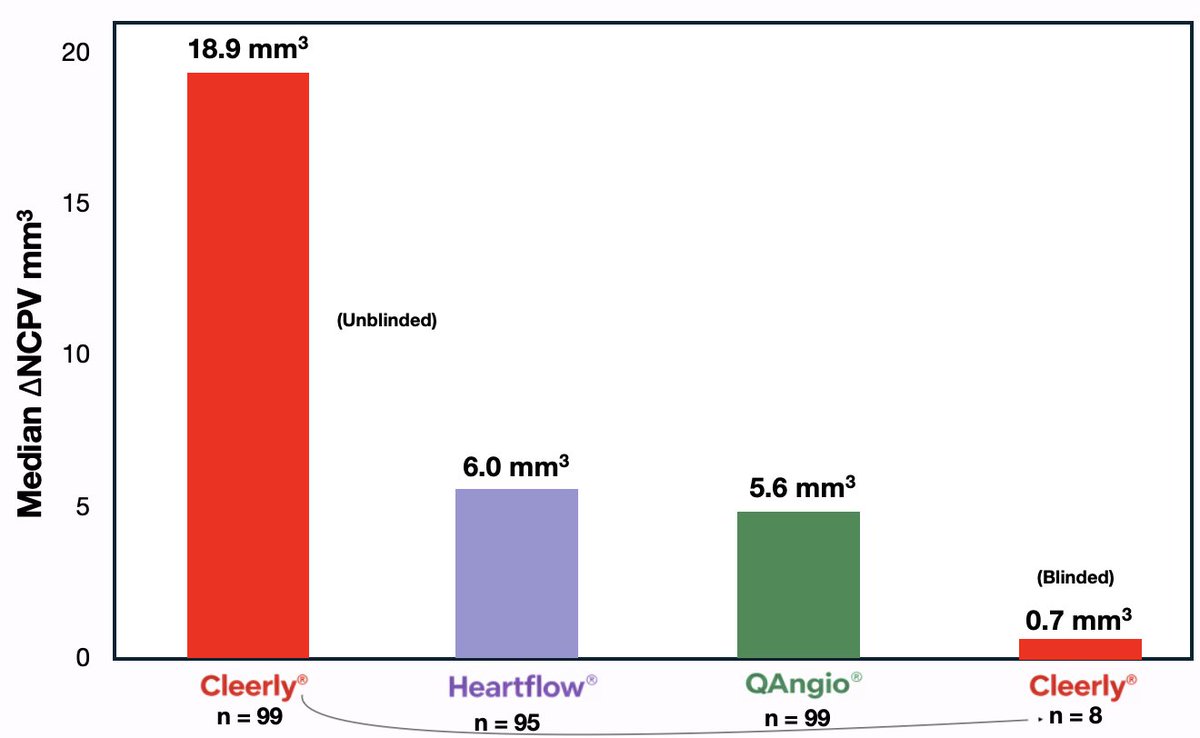
I realize the KETO-CTA study has caused a lot of confusion over the past year. That's why my colleagues and I are so excited to clarify matters. I also recognize that the chronology of events, the complexities of the scientific bureaucracy, and additional analyses conducted out of necessity, add additional layers of complexity. So let me make it as simple as possible with this little graph. The massive red bar represents the original Cleerly analysis, which—unbeknownst to myself, Dave, and Adrian—was inappropriately unblinded. Cleerly refused to redo the analysis with proper blinded, so multiple independent analyses were performed, including by HeartFlow, which was properly blinded, and by the pre-registered QAngio methodology. As you can see, these are in tight alignment. Additionally, as a workaround to obtain a blinded Cleerly analysis, several participants were generous enough to resubmit their scans via their personal cardiologists to serve as a de facto Cleerly blinded analysis, allowing us to see whether Cleerly would replicate their results under blinded conditions. They did not. The median progression for these eight participants dropped from 18.9 mm³ non-calcified plaque volume to <1, i.e. no plaque progression. In fact the mean progression went from around +20 to −5 mm³, a COMPLETE DIRECTIONAL REVERSAL Now, some are incorrectly suggesting we are trying to hang our hats on an N = 8 and performing mental gymnastics for data we don’t like. Forgive me for saying it, but this is an ignorant—if not outright stupid—claim that itself requires willful ignorance or mental gymnastics. We are not hanging our hat on eight participants. We are hanging our hat on: 👉Three coherent analyses that largely agree with each other, including ... 👉The pre-specified methodology, and ... 👉An independent fully blinded analysis, and... 👉A blinded analysis done by Cleerly itself which could not be more discordant from the original unblinded Cleerly analysis (which Cleerly refused to repeat in a blinded fashion). Those are the facts. And while science is never settled, the data on this KETO-CTA board looks a lot like checkmate. ht/@AdrianSotoMota @realDaveFeldman
I feel like I can breathe again! Get ready for a rant I've been waiting to let loose for a year. 🔥 First, here are the core facts about the Keto-CTA study to date: 🚨PART 1: THE FACTS 👉From its inception, Dave, Adrian, and I, being associated via the funding body (the Citizen Science Foundation), were blinded to certain elements of the data. The purpose was to protect the integrity of the project. 👉The profound irony is this also meant that, prior to publication, we couldn’t perform certain ‘checks’ and had to trust others to do so. Speaking for myself, it’s now painfully clear that was a mistake. 👉However, after the April 7th paper was published, "anomalies" (if I’m being polite) were noted with the Cleerly scans. 👉 Cleerly refused to redo the scans, despite multiple requests and being offered payment. 👉Importantly, and to my dismay, the original Cleerly reads were UNBLINDED, introducing a major source of bias. 👉At additional expensive, the scans were rerun through HeartFlow in a properly blinded analysis, and via the pre-specified QAngio methodology. 👉HeartFlow and QAngio agreed with each other and were discordant with the Cleerly analysis. 🚨PART 2: THE NEW NEWS What happened next was brilliant! And, truth be told, I only found out about it yesterday. For my own legal security – and at the recommendation of my friend and colleague who was taking the worst of it on the back end – there was a lot I didn’t know until this point. This is what happened… 👉Several participants independently submitted their scans to Cleerly as a workaround to obtain a truly blinded Cleerly analysis. 👉Those results were highly discordant with the original Cleerly analysis and aligned with the HeartFlow and QAngio analyses. The difference between the original Cleerly scans and the repeated blinded scans was massive! The original unblinded analysis reported a +20.9 mm³ mean increase in non-calcified plaque volume, while the blinded repeats showed a -5.1 mm³ mean decrease. I mean, MY GOODNESS!!! I basically did a backflip when I found out (@realDaveFeldman can release the footage of the meeting at his discretion) If you’ve been following the KETO-CTA story up to this point, the consistency of the findings across HeartFlow, QAngio, and now Cleerly itself (based on the blinded reads) should bring much-needed clarity. The converging results fundamentally reshape the narrative and directly refute the claim that the study demonstrates massive, unprecedented plaque progression in LMHR and near-LMHR And, after all that, the fact remains that every single analysis found no association between ApoB levels or LDL exposure and plaque progression. LET ME REPEAT: And, after all that, the fact remains that every single analysis found no association between ApoB levels or LDL exposure and plaque progression. 🚨 PART 3: NEXT STEPS In terms of next steps, I’ll quote my colleague Dave: “we have already taken steps regarding last year’s paper that contained the original Cleerly analysis.” I’ll leave it at that for now so I don’t overstep. But let me say, that’s the highly polished and diplomatic version. I certainly have stronger words about this process, but perhaps now is not the time. Where I will speak more plainly is in regard to the behavior of some detractors over the past several months. In a few cases, I’ve reached out privately to individuals who should know better, gently suggesting that, in light of the new evidence (Heartflow and QAngio), it might be time to reassess or lighten the abuse. For anyone sincerely paying attention—and for anyone with even modest insight into how scientific bureaucracy works—I hope it is now clear why we were not more forthcoming earlier in the process. 👉And trust me when I say, it’s never been harder to keep my mouth shut about anything in my life. I've accumulated more cortisol AUC in the last 11 months then in the entirety of my life to age 29. 🚨PART 4: SPEAKING FOR MYSELF Speaking for myself, I have been beyond frustrated and disappointed. At multiple stages, it has become painfully—and increasingly—clear to me that our scientific system, which presents itself as purely meritocratic, is far more political than most would imagine. These are difficult words for me to say as someone who comes from a family of doctors and scientists and who has spent his entire career in academic institutions—multiple Ivy League universities @Harvard @dartmouth, two doctorates, and top-ranked institutions in both England @UniofOxford and the United States. I was groomed in conventional academic medicine. If I have any bias, it’s to see the best in conventional medicine and modern scientific process. Most of my loved ones have made their living within this ecosystem. But when you pull back the curtain, the reality can be sobering. To those detractors who have verbally abused or personally attacked my colleagues and me—perhaps out of naivete or ignorance—I will say this plainly: it’s time to check yourselves. Too many people have spoken out of turn, seemingly to score points rather than to engage thoughtfully with an evolving scientific story—one that has been evolving for quite some time. When the HeartFlow and QAngio analyses were released, that alone should have prompted serious reflection. At minimum, it should have raised questions. The subsequent silence from some of the loudest critics, after they believed they had “won” a round, is telling. Science deserves better than scorekeeping. It deserves intellectual honesty and the humility to update one’s position when new evidence emerges. At times over the last year, the lack of curiosity, sincerity, and intellectual honesty from people who I tried to give the benefit of the doubt has made me want to vomit. And trust me when I say, this isn’t a victory lap. This is a promise. We are now over a hurdle that I have been waiting for almost a year. And frankly, I am ready to run headfirst through brick walls with my colleagues and friends by my side — those whom I trust to pursue the hard questions and the honest answers — and do so indefinitely using the tools and resources at our disposal, even when, and especially when, the scales are improperly tilted against us. Lucky for us, the intellectual environment is expanding — the black box of academia beginning to crack open. So someone hand me a crowbar, because I’m committing myself fully and completely, over the coming years and decades, to prying it wide open. Not gently. Not quietly. But decisively. My final words of this verbose dissertation? LFG


Your brain is 25% cholesterol. Your doctor prescribes a drug that blocks cholesterol synthesis. Your brain fog is a mystery.