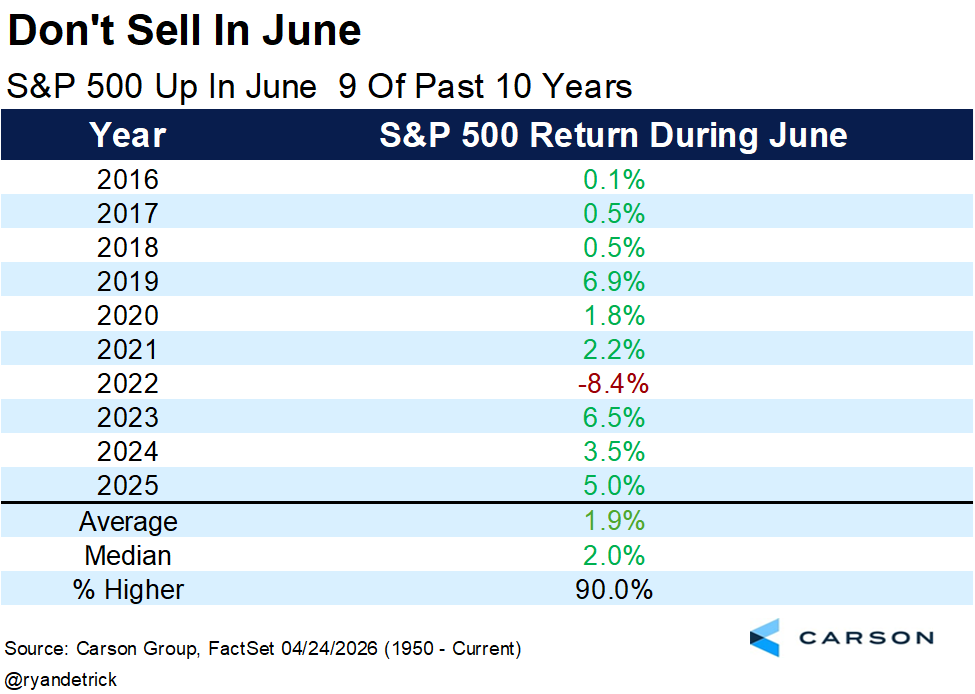
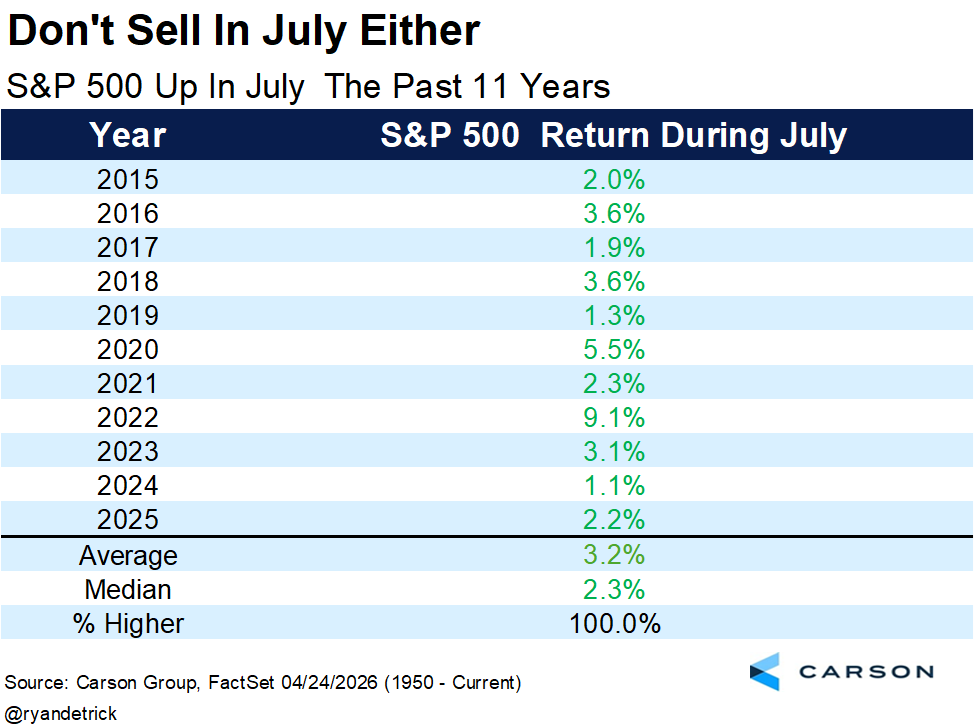
550M

117 posts

550M banner
550M

550M

@chart550M

Chart analysis and dark pool/option flow insights provided are for educational purposes only. Not financial advice or a trade signal.

Katılım Mart 2026
17 Takip Edilen1.1K Takipçiler
Sabitlenmiş Tweet
550M
550M@chart550M·
The prevailing fintwit narrative comparing this current $QQQ and $SPY rally to April 2025 overlooks several critical structural divergences. While the 'price action' may mimic April 2025 on a surface level, the underlying mechanics are completely different this time around: > Dollar divergence: Last year’s uptrend was fueled by a weakening dollar - $DXY put in a death cross in April 2025. This time, equities are fighting a golden cross on the DXY. The tailwind has officially become the headwind. > Sector rotation: The overall trend is still towards defensive sectors on the weekly and monthly timeframes. Last April, it was a violent rotation back towards offensives. > 
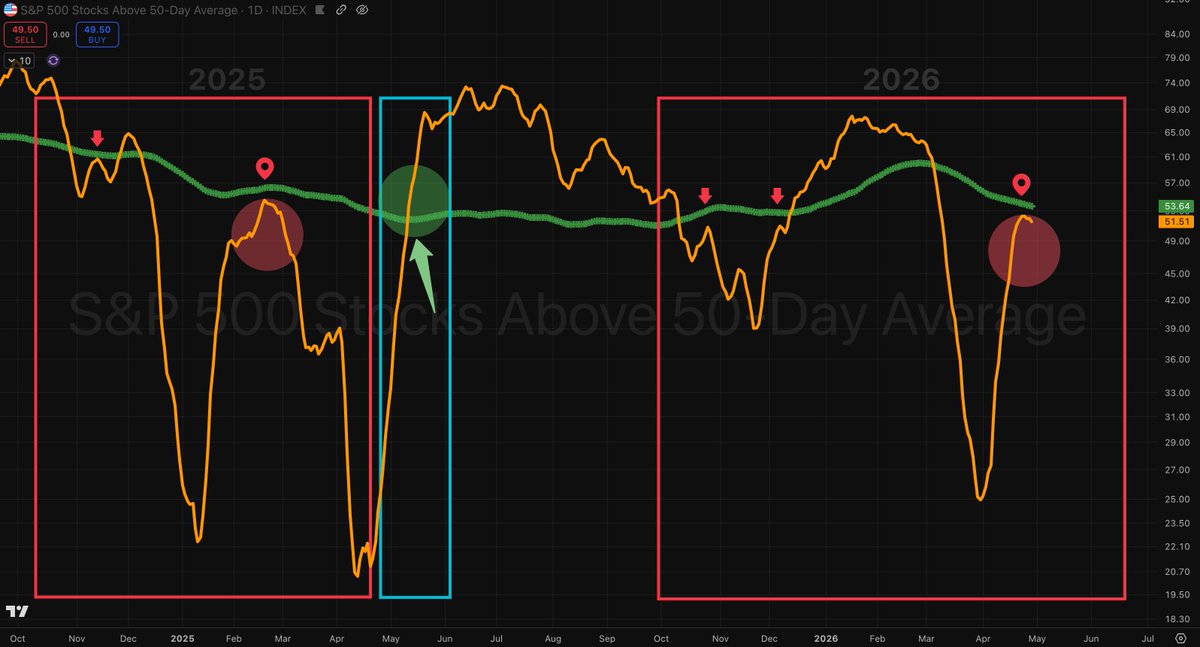
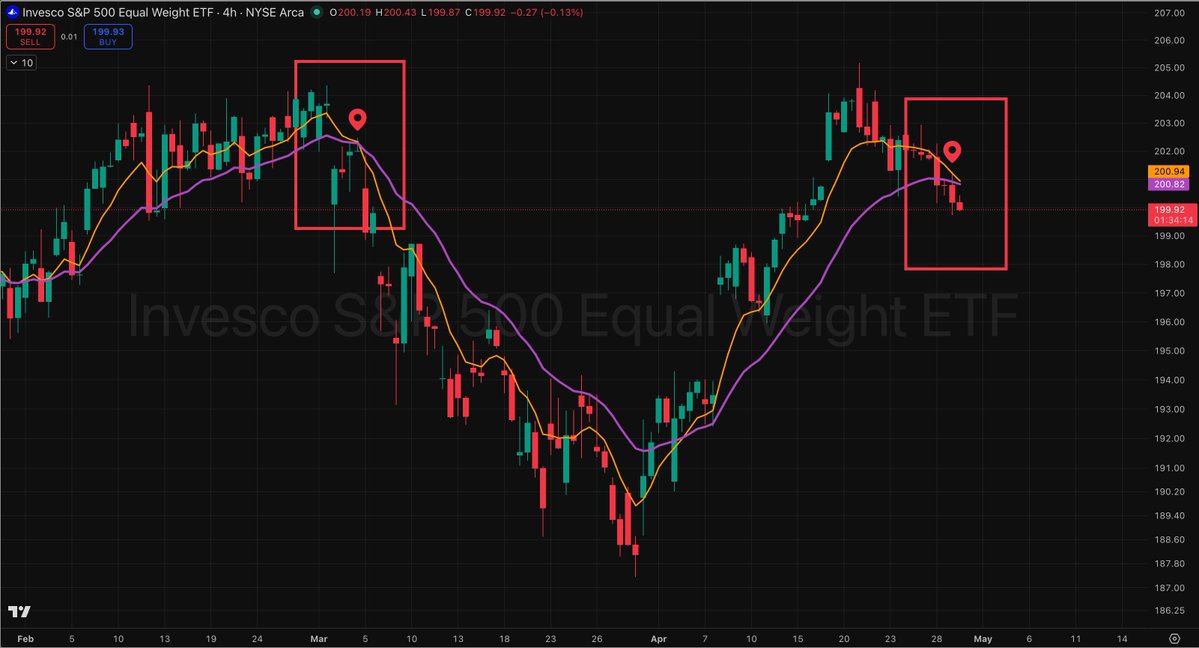
Broken breadth: While the indices look strong, the % of stocks reclaiming their 20dma and 200dma is struggling. Completely different than the April 2025 recovery where these moving averages were reclaimed with absolute ease. > Anemic volume: We are seeing significantly less conviction than we did in 2025. This move up is on even lower volume than last year. > 
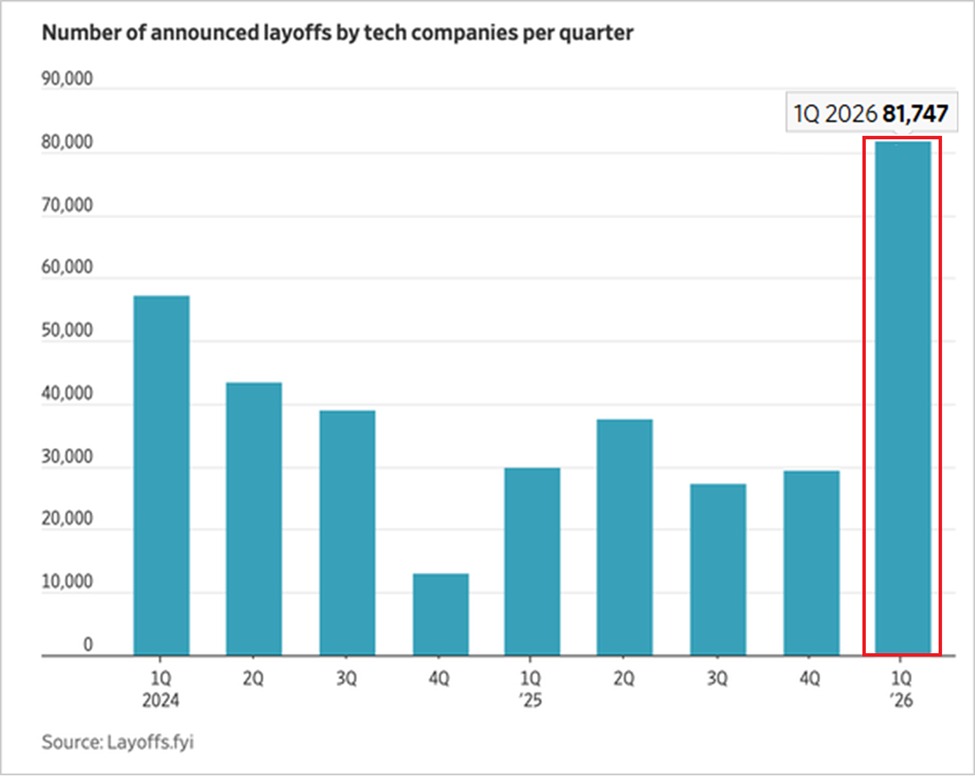
Macro context: All of this is happening against the backdrop of an unprecedented, imminent energy shock. This move higher lacks the structural integrity of last year. It's a hollow rally.
English
2
3
29
14.9K
Heisenberg
Heisenberg@Mr_Derivatives·
$SPY 10 of the 13 new Fed chairs saw at least a 10% drawdown in their first year. Warsh can officially start as early as this month I believe. Fwiw H/t Barclays, Fundstrat
Heisenberg tweet media
English
20
13
107
16.8K
Michael Bento
Michael Bento@MichaelPBento·
Those seeds have already been sown over the last couple of weeks. Everyone is in, and no one thinks anything can bring this market down. It’s exactly the conditions in which prior crashes have taken place. Will it happen Monday? Probably not, but we are probably measuring in months not years now
Concepts@everyvote_prize

@MichaelPBento Everyone’s going to act so shocked and befuddled when it happens too. I can’t say when the music is going to stop, but I can’t say say this is so much worse than regular people understand.

English
9
2
72
7K
The Kobeissi Letter
The Kobeissi Letter@KobeissiLetter·
Tech layoffs are skyrocketing: Tech companies announced 81,747 layoffs in Q1 2026, the highest quarterly total since at least Q1 2024. Layoffs have more than DOUBLED from the previous quarter and have risen +580% since Q4 2025. March alone saw 45,800 announced job cuts, the worst single month for tech layoffs in at least 2 years. Tech layoffs are set to remain elevated with Meta's, $META, recent plans to cut ~8,000 employees. Furthermore, Microsoft, $MSFT, is offering voluntary retirement to ~7% of its US workforce, which could transition into layoffs if participation is low. This comes as tech giants shift spending toward AI chips and data centers, trimming staff to free up capital for infrastructure. US tech employment is rapidly contracting.
The Kobeissi Letter tweet media
English
208
564
2.1K
295.8K
TT3
TT3@TradingThomas3·
Historically, after a 10%+ monthly move, the market tends to transition from a strong trend into a more choppy, range-bound environment. It shifts into a stock picker’s market, where the broader index stalls, but leaders (often semis and Mag7) can still grind higher while laggards play catch-up, making rotation more important than overall direction. Dip buyers remain active, so pullbacks are typically bought, but the upside usually cools off from explosive rallies into a slower, more methodical grind higher.
English
27
21
348
38.8K
550M
550M@chart550M·
While everyone was distracted by earnings noise, $MSFT just finalized a decade-level structural signal: $MSFT officially printed a monthly 8/21ema bearish cross this week. This has happened only 4 other times since its 1986 IPO... Every single occurrence coincided with a major macro regime change: > 2000: The dot-com peak > 2006: The top of the housing bubble > 2008: The GFC acceleration > 2022: The end of the zero interest rate policy era And 2026 is now the 5th time: The global energy crisis. Trends at this scale move slowly, but they are the most objective indicators of capital flow. Given Microsoft's index weight, this breakdown represents a significant structural headwind for both $SPY and $QQQ. It's a sign of things to come. (8ema🟠/ 21ema🟣/ bearish cross🟥)
550M tweet media
English
6
6
48
9.6K
550M
550M@chart550M·
@JohnSmithxmo0 The VIX defines the expected range, but not the direction since it only measures vol. For the actual direction of the move, examining the internal structure is a much more reliable tell.
English
0
0
0
56
John Smith
John Smith@JohnSmithxmo0·
@chart550M Suppose when the VIX gives some more signals for now not much
English
1
0
1
96
550M
550M@chart550M·
Almost no one uses this chart correctly... but it's one of the best ways to tell if a move up will continue or fail. The answer becomes very apparent for the current $QQQ and $SPY move when you look at the internal structure under a different light: This is a daily chart of the percentage of $SPY stocks above the 50 day moving average. I removed the candlesticks because what matters most is not the actual raw percentage, but the interaction between its own moving averages. Specifically the 10ema🟠 and 200sma🟢 for the percentage itself. The last time the 10ema struggled to get above the 200sma following a deep move in breadth was Feb 2025 prior to the tariff selloff. We are seeing that same failed expansion pattern happening right now. Conversely, in order for a move up to fully sustain, the 10ema needs to slice above the 200sma with absolute ease like it did back in May 2025 during the recovery. That is clearly not the case currently. This doesn't necessarily mean the exact top, but when internal momentum stalls against long-term moving averages while also making lower highs, it's worth paying attention to.
550M tweet media
English
4
9
85
25.4K
550M
550M@chart550M·
Fair point, anything can resolve upward. But this is about weighing probabilities, as you already know well. A stall at the 200sma with accelerating internal decay isn't usually the foundation for a sustainable breakout, especially in the context of significant sector rotation toward defensives in both equal and market-cap weighted terms.
English
0
0
2
188
Swingtrader
Swingtrader@Swingtrader·
I do similar stuff like this, it’s a good concept but there’s also something else to mention here The line can ultimately end up moving up instead of down - meaning people start bidding stocks That’s how breakouts form So while it’s a good concept - it’s not gonna tell you the move, it’s just another data point and good to “look back at” and say “duh!”
550M@chart550M

Almost no one uses this chart correctly... but it's one of the best ways to tell if a move up will continue or fail. The answer becomes very apparent for the current $QQQ and $SPY move when you look at the internal structure under a different light: This is a daily chart of the percentage of $SPY stocks above the 50 day moving average. I removed the candlesticks because what matters most is not the actual raw percentage, but the interaction between its own moving averages. Specifically the 10ema🟠 and 200sma🟢 for the percentage itself. The last time the 10ema struggled to get above the 200sma following a deep move in breadth was Feb 2025 prior to the tariff selloff. We are seeing that same failed expansion pattern happening right now. Conversely, in order for a move up to fully sustain, the 10ema needs to slice above the 200sma with absolute ease like it did back in May 2025 during the recovery. That is clearly not the case currently. This doesn't necessarily mean the exact top, but when internal momentum stalls against long-term moving averages while also making lower highs, it's worth paying attention to.

English
1
1
22
5.9K
550M
550M@chart550M·
@ihavedumbtakes Happy to help, internal structure is everything right now
English
0
0
0
53
550M
550M@chart550M·
10ema🟠 continues to stall out below the 200sma🟢 Underlying decay is accelerating, while $SPY remains only slightly red. This structural divergence usually resolves with a sharp move, especially in the context of massive sector rotation towards defensives. Clear risk off.
550M tweet media
English
1
0
8
837
550M
550M@chart550M·
@Mr_Derivatives $RSP is about to put in an 8/21ema bearish cross on the 4 hour chart. The last time it did that was March 4th, the start of the $SPY March correction. Think a bounce is unlikely here.
550M tweet media
English
0
0
0
234
Heisenberg
Heisenberg@Mr_Derivatives·
$RSP Equal weighted S&P500 etf is now down 7 days in a row. Tied for the longest losing streak since April 2024.. Play for a bounce soon?
English
18
3
86
27.1K
550M
550M@chart550M·
@yes_risk @JavierBlas I'm leaning more towards offshore rigs basket $NE $BORR $SDRL $VAL $RIG
English
1
0
4
377
Javier Blas
Javier Blas@JavierBlas·
The world is calling on the barrel of last resort — and it’s brutal for the US. American total petroleum exports (crude and refined products) surged last week to an all-time high >14m b/d. The price? US total inventories plunged at ~3.5 million b/d last week. Unsustainable.
English
58
422
2K
195K
jbulltard
jbulltard@jbulltard1·
CENTCOM HAS PREPARED FOR SHORT WAVE OF STRIKES ON IRAN i guess back to war
English
8
2
85
9.3K
Ariel Hernandez
Ariel Hernandez@RealSimpleAriel·
We just aren't seeing that breadth expansion as I'm sure most of us would have loved to see. $XLI $XLU $XLV $XLP $XLF $XLB $XLC $XLY all slightly underwhelming right now. Maybe things change after this FOMC and big 4 earnings reports tonight.
TheChartGuys@ChartGuys

@RealSimpleAriel I would have preferred a bit more rotation during this semis consolidation. XLV weekly bear flag. XLF saw a bit. IGV nothing.

English
13
4
68
32.4K
550M
550M@chart550M·
The $RSP 4 hour chart is also on the verge of an 8/21ema bearish cross. The last time we saw this structural breakdown was March 4th, the beginning of the March $SPY correction. Internal momentum is diverging across the board.
550M tweet media
English
1
0
14
1.5K
Joeri
Joeri@joeriwestland·
The higher oil prices go, the more likely Trump is to issue some kind of oil/product export restrictions or bans. If so, Brent-WTI spread will show a massive blow out. Brent exposure >>> WTI exposure imo $OOTT
English
22
6
167
22.4K
Ryan Detrick, CMT
Ryan Detrick, CMT@RyanDetrick·
The S&P 500 has been up 12 of the past 13 Mays. The S&P 500 has been up 9 of the past 10 Junes. The S&P 500 has been up the past 11 Julys.
Ryan Detrick, CMT tweet mediaRyan Detrick, CMT tweet mediaRyan Detrick, CMT tweet media
English
25
75
448
47.2K