yodo retweetledi
yodo
1.6K posts


yodo
@criptoyodo91
Buying and selling shit - You Only Degen Once 🇮🇹🏴☠️
Katılım Aralık 2020
1.2K Takip Edilen166 Takipçiler
yodo retweetledi
yodo retweetledi

yodo retweetledi


yodo retweetledi

. @cz_binance gift us a Santa BSC season please all you have to do is tweeting more 👉🏼👈🏼
English
yodo retweetledi

Tonight I was hacked for over 900K USD.
Both my ERC-20 and Phantom wallets got drained simultaneously.
A huge blow that I don’t think I will recover from.
All my time in crypto I’ve tried to help others as much as myself by sharing every move I make on TG.
Anyway you could help me @zachxbt
RTs appreciated

English
. $biao 2.4m at this post, just hit 8m
Still holding all my bag, higher
Unihαx0r~@0xUnihax0r
Some memes coins I like on BSC, in addition to $giggle and $priceless, different narratives but perfect in their own lanes: #旺柴 - $biao - $safu - $binancians What to add? Shill me some nice stuff
English
@IamZeroIka Thanks Ika, very helpful for learning :)
Are you from Italy?
English

👁️ Educational video on using the FRVP to build a long/bullish thesis 👁️
English
yodo retweetledi
🎯- Educational content: Qualifying demand/supply areas based on market activity - 🎯
This is probably one of the most important educational content I wrote and I suggest you to carefully read it since I believe it will help you to understand but most importantly to contextualize the areas you're watching on your charts in the way I do it. (and I believe it works)
--------------------------------------------------------
1⃣ Theory
In my opinion, you cannot qualify a demand or supply zone based on levels alone, and this is where so many people go wrong.
A horizontal box drawn around a low or high may look neat and convincing on a chart, but in isolation it tells you nothing about the structural participation of the market.
A “zone” is only an assumption until the depth of activity within it is qualified, and this qualification cannot be derived from price alone.
Price is simply a print on the tape: it is the reflection of trades that have already taken place.
Without context, without the density of volume that shows us where business was actually conducted, those levels are hollow drawings that might just as well be wishful thinking.
The FRVP (Fixed Range Volume Profile) is what transforms an arbitrary level into a zone with statistical legitimacy.
The reason context is non-negotiable is because market structure is an auction, and auctions do not revolve around arbitrary highs and lows, but around the negotiation of value.
The FRVP offers a lens into this negotiation by displaying where the majority of transactions occurred within a defined segment of price action.
This creates what I like to call a "map of the battlefield": where buyers and sellers have already agreed on value, where value has been rejected, and where price is attempting to build or fail to build acceptance.
Without this, the notion of a demand or supply zone is just narrative and not evidence.
If price taps a level that you’ve drawn as supply, but volume data shows it sits in a thin, low-participation pocket, the rejection there is unlikely to be sustained as it’s air, not foundation.
If price interacts with the VAH (Value Area High) and is instantly rejected, that rejection is not arbitrary but it's a clean evidence that participants are unwilling to reprice value higher, and this transforms a level from conjecture into a statistically-qualified zone.
Similarly, if a demand zone aligns with the VAL (Value Area Low) and price begins to build acceptance above it, the implication is that buyers are attempting to redefine value upward from the outer boundary of consensus.
These are actionable insights that cannot be gleaned from candlesticks alone.
The problem with relying on levels in isolation is that it assumes the market respects static lines...well, it doesn’t.
The market respects liquidity, and liquidity is embedded in volume.
A level may appear to hold price for a moment, but unless the FRVP reveals substantive order flow and distribution there, that “hold” is fragile.
The VP tells you whether the market considered that level worth fighting over, or whether it was simply bypassed with little interest, making this the context that separates professional qualification from amateur annotation.
And this brings us back to mitigation and unmitigation.
A mitigated zone sitting at the POC is not the same as an untouched unmitigated zone resting at the Value Area Low.
One has been normalized into the market’s perception of fair value, while the other still carries untested liquidity that can fuel an aggressive move.
FRVP is the only tool that lays this out clearly as it distinguishes between zones that have been processed and zones that remain potent.
To pretend otherwise, to treat all levels as equal simply because they’ve been drawn on a chart, is to reduce analysis to little more than drawing areas and hoping.
The blunt truth is this: you cannot qualify demand and supply without volume, and you cannot contextualize volume without the profile.
2⃣ Application + explanation
The starting point is always the same: anchor your FRVP from a meaningful swing high to a meaningful swing low (or vice versa, depending on the direction of the move).
"Why from swing high to swing low?"
Because this isolates the auction leg, the segment of market activity where the imbalance originated.
A swing high followed by an impulsive move down is the beginning of a potential supply structure.
A swing low followed by an impulsive move up is the beginning of a potential demand structure.
By anchoring your FRVP across this exact leg, you capture the entire distribution of traded volume that underpins the move which is not arbitrary, it’s the footprint of where "business" was done, and it’s the only way to distinguish whether your “zone” is real or a mirage.
👁️When you apply the FRVP from high to low, you are left with 3 critical levels:
- POC (Point of Control): The single price level where the most contracts or shares traded.
If your supposed demand or supply sits directly at the POC, understand that this level has already been normalized into the market’s perception of fair value.
Don’t expect explosive rejection as it’s processed liquidity.
- VAH (Value Area High): The upper boundary of 70% of all traded volume within that swing.
Supply zones that overlap with VAH are powerful when price retests and rejects them.
Why? Because they mark the edge of accepted value.
If the market refuses to build above that edge, sellers are defending.
- VAL (Value Area Low): The lower boundary of that same 70% distribution.
Demand zones that overlap with VAL gain legitimacy when price retests them and then builds acceptance back above. Buyers are showing up to keep value inside the range.
Now watch what happens when you use this method concretely.
Let's say that price drives down from a swing high, leaving behind what you’ve identified as a potential supply zone.
When you anchor FRVP from that swing high down to the swing low of the move, you can immediately see whether your zone overlaps with the VAH or whether it sits in a thin low-volume pocket above value.
If it aligns with VAH, rejection there carries real structural weight as it’s the market defending value.
If it sits in a low-volume pocket above VAH, it may act like a vacuum where price snaps back quickly but struggles to hold.
If it’s at the POC, don’t fool yourself into expecting an outsized reaction as that’s where the market already agreed value resides.
3⃣ Examples
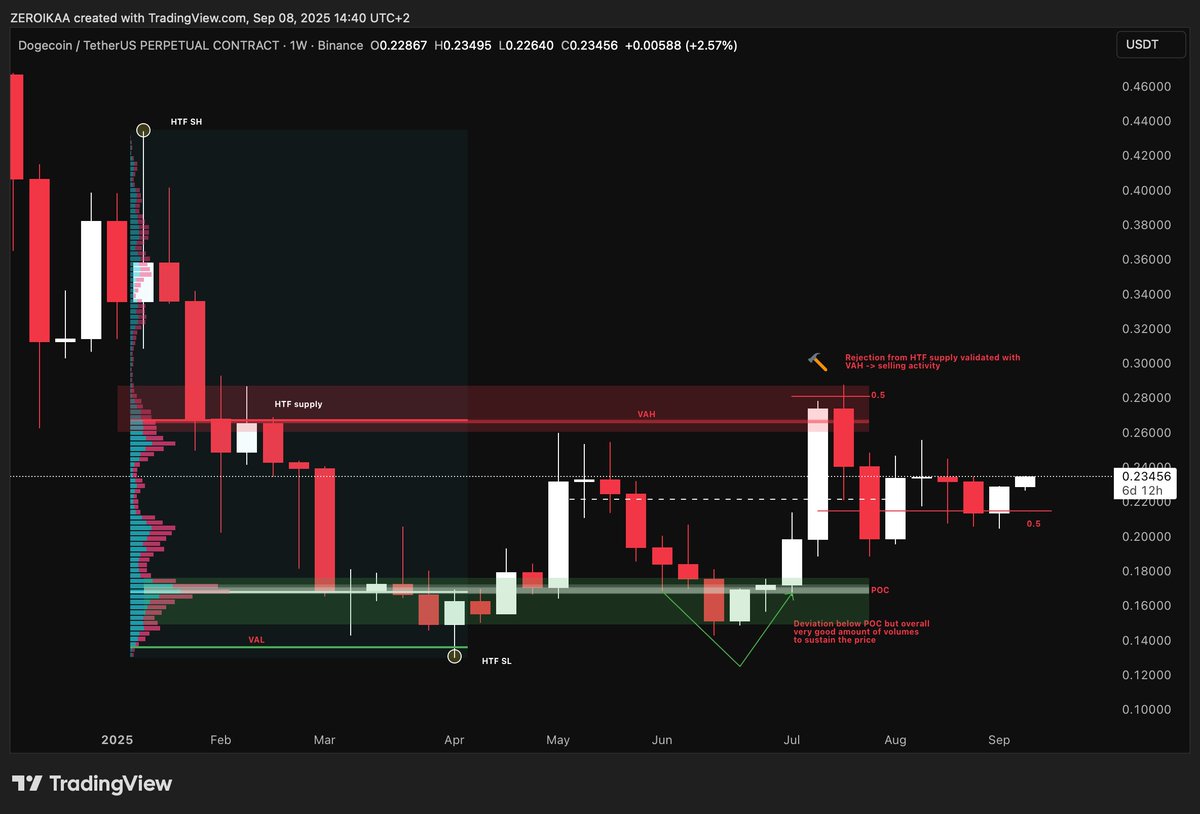
1. DOGE HTF areas validation: ("novice")
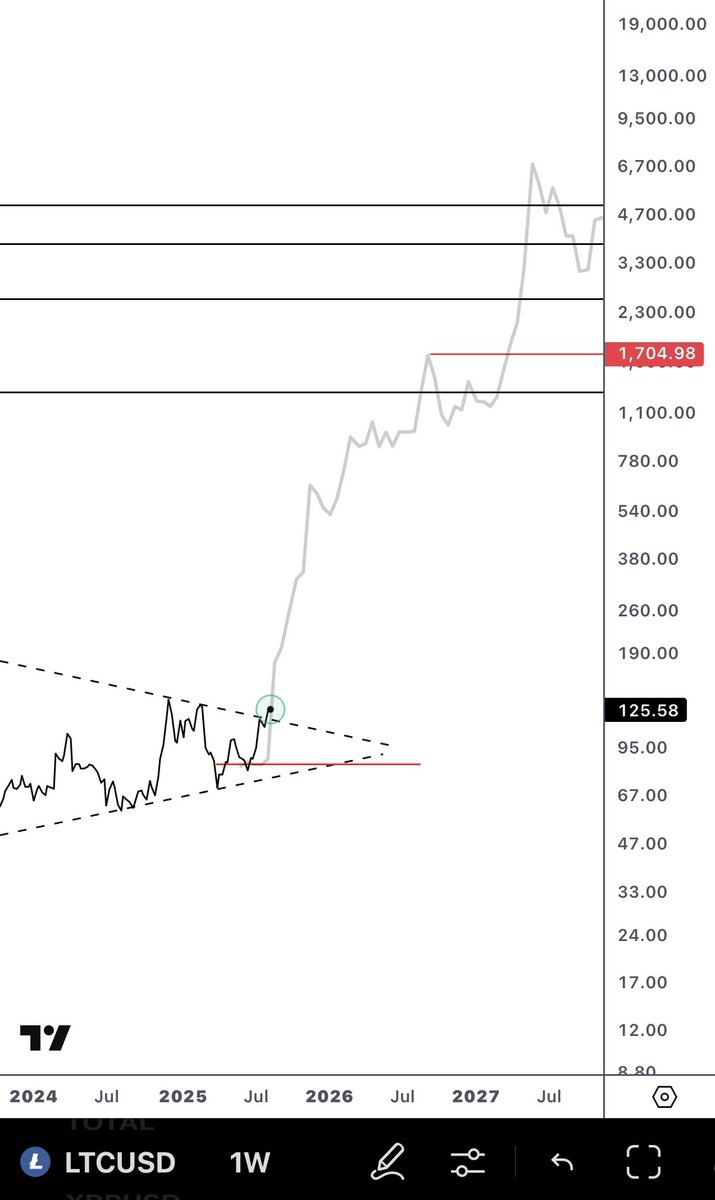
2. LTC HTF areas validation + breakers ("intermediate")
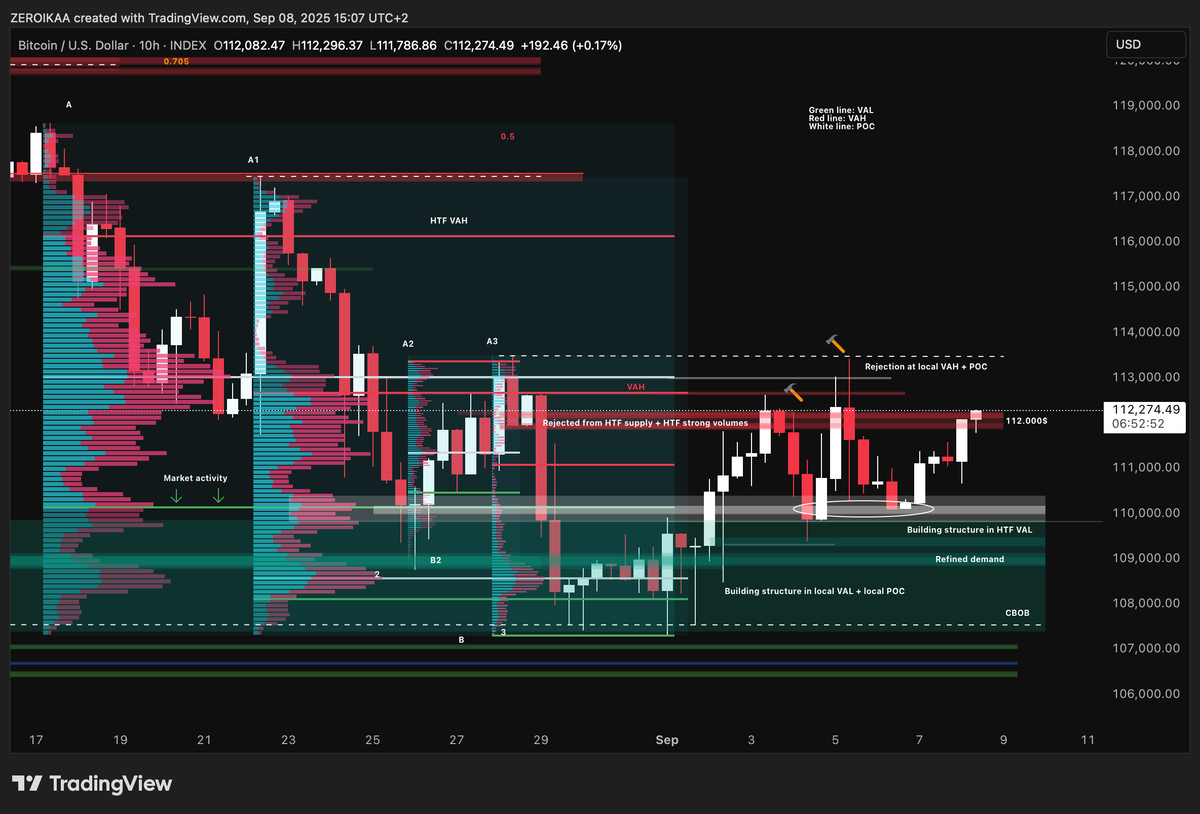
3. BTC MTF + HTF areas validation 4x VP ("advanced")
As you can see from the examples above you can overlap VPs in order to have a clean map of different VAHs/VALs/POCs based on the context and on the timeframe, giving you a fantastic and sound perspective not only on the areas, but also to build your long and short theses depending on how the price action evolves (above or below volume clusters)
こちらの内容が気に入ったら、「いいね」と「リポスト」をぜひお願いします!

English

🔥 $10k giveaway - 10 winners $1000 each🔥
Rules:
Like & RT
Must be following @cryptogodjohn @WealthGroup
Tag 2 friends
Winners drawn 8/26
English
English
yodo retweetledi

Remember that insane $PEPE run from $400M to $4B MC?
That was me.
I made $15M+ on just that one play.
📜 Proof: x.com/whalepumprebor…
And today… I’m revealing the next move. 👇
On CT, many copy my TG analysis & repost it as theirs here. They follow me and pretend I don’t exist, and I let them.
Why?
- I’m too rich to care
- I don’t give a fuck about them
- I’m barely active on X
But make no mistake: most of CT are small players compared to me.
My group (link in bio) has 8 years of trade history.
I was Top Trader by PNL on Binance for 8 consecutive months before quitting CEXs and moving fully into DeFi.
We caught every single BTC bottom.
In March 2020, while the whole world was capitulating, my people became millionaires in one trade. If you know the day I’m talking about, you know.
And $PEPE wasn’t the only one. I also made many others explode with crazy profits, and every move is verifiable, both on my profile and inside my group. This is my specialty.
⚔️ Share this post. The more we are, the higher our chances. Market Makers win by isolating traders, they can’t fight a crowd that moves together.
Since 2017, I’ve made countless people rich. I’ve fought real wars against reckless Market Makers. Sometimes I got burned, but most of the time I printed money like I was the FED.
Remember GameStop? I’ve done the same thing multiple times, but in crypto.
And now, a new war begins.
Market Makers are overexposed to one token: $TST.
Short.
A BNB memecoin launched by @binance’s own team, “miraculously” listed… and CZ pretending he didn’t know even after tweeting about it himself to artificially pump it 👀
See for yourself:
x.com/cz_binance/sta…
📜 Contract: 0x86Bb94DdD16Efc8bc58e6b056e8df71D9e666429
Price at time of this post: 0.027
The truth? $TST was never just a meme. It was an orchestrated PR stunt to generate activity on Binance Chain.
I made $2m the very first night just buying it.
From day one, Market Makers manipulated the price with brutal wicks, liquidating retail traders up and down and farming their liquidity.
And here’s the kicker: The TST dev wallet dumped its last holdings a few days ago, even though CZ swore Binance had “no control” anymore.
Receipts: x.com/WuBlockchain/s…
Current situation:
• Market cap ≈ $25M
• Brutal red wicks nuking everyone
• Capitulation: longs destroyed one after another
• Yet daily volume often > market cap
Open Interest? 🔥 85% of the market cap.
And my trusted sources confirm: Market Makers are WAY too exposed short.
This is the exact setup I’ve been waiting for.
What I am doing now:
- Buying SPOT only (never futures)
- Accumulating gradually
- Cornering a massive chunk of supply
- Force MMs to double down until they’re trapped
Why SPOT only? Because in futures, they wick you out with surgical precision before spot can react.
I repeat, DO NOT buy futures, THEY WILL KILL YOU.
In spot, every token you buy = one less token in their hands. Eventually, they’ll have nothing left to dump.
Once spot supply dries up, MMs will be cornered, begging for a reversal. That’s when we apply maximum pressure.
⚠️ Warning: this is high risk. War isn’t safe. Only use what you can afford to lose. THIS IS NOT FINANCIAL ADVICE. If you join my war, you are ready to die. You can get butchered, you are the only one responsible.
Follow or don’t, your choice.
But remember: When Market Makers fall, the rewards are massive… and the victory is glorious.
The first shots have been fired.
The war has begun.
WhalePump Reborn@WhalePumpReborn
Took a 1.2m USD long on PEPE. Do what you want with this information.
English
yodo retweetledi

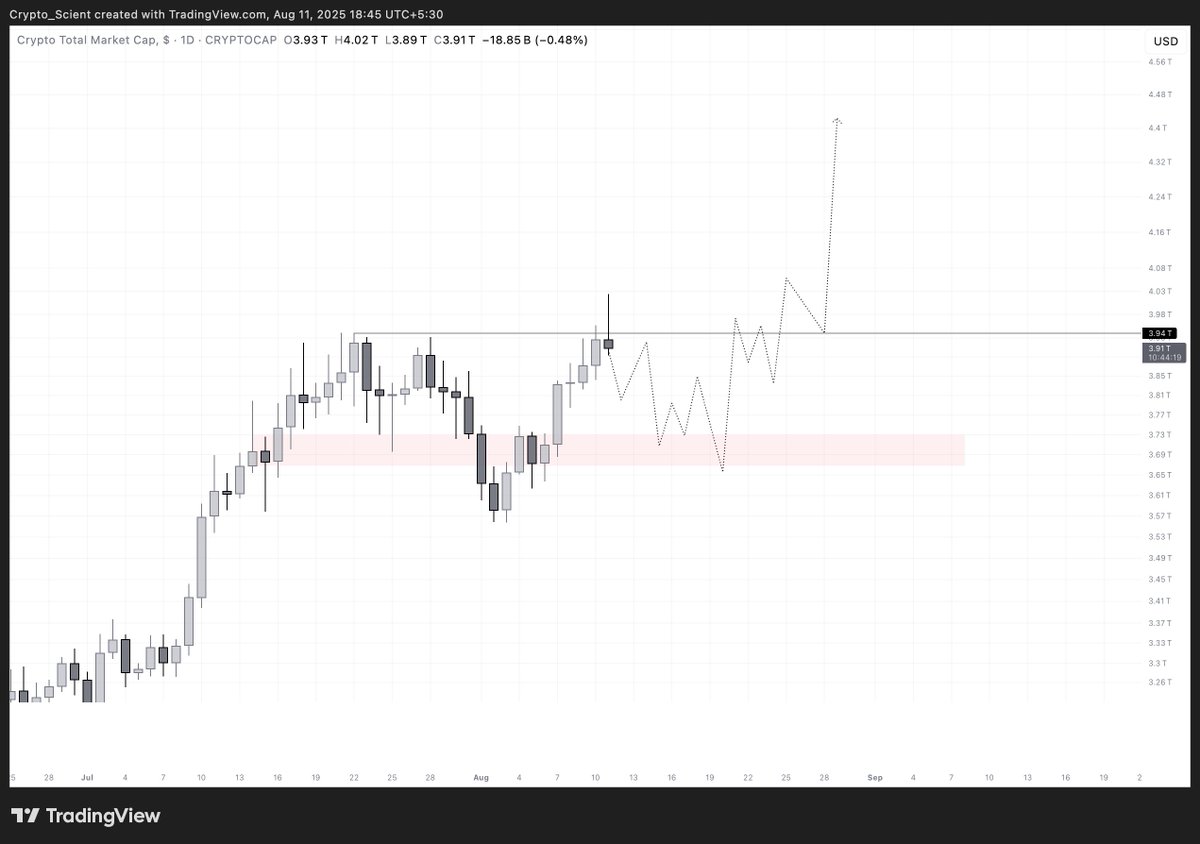
#TOTAL, Some cooldown here would make sense.
• We already formed a bearish SFP on 12h and 1D looks to be headed the same way. Confirmation on 1D I'd expect continuation lower this week.
A little push down to 3.7T would fix a lot of Altcoin charts and fill up some of the $ETH gaps left during this move up.
Let's see.
English
@Crypto_Scient question: why do you consider 3D timeframe? with the 1D candle already closed below the support.
Genuinely curious about this
English
$BTC.D — Bouncing again from the green support zone with 3D closing bullish today and we have bull divs on RSI
Expect some more upside here.
The LTF rejection level sits at 61.5% — if we break above it and push into the grey resistance zone, I’d expect a breakout attempt toward the red zone above.
For $ETH to continue higher in the short term, BTC.D needs to show weakness and stay below 61.5% on LTFs.
RR not good for Altcoins here unless we break below the green zone (support)
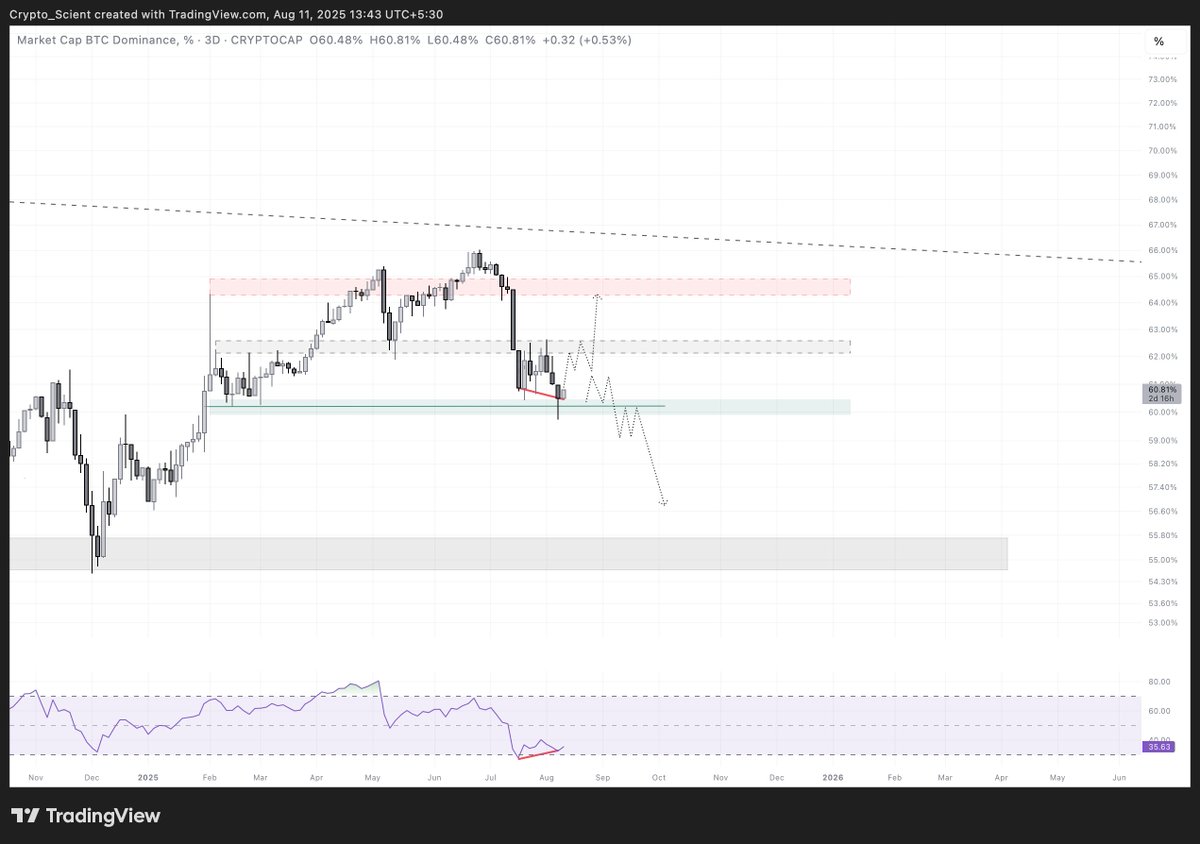
Scient@Crypto_Scient
$BTC.D, 3D closed today as a bearish candlestick after briefly deviating above resistance on LTF Since we are back below resistance, we can now test the green zone (support) again and range more in this zone. $ETH is strong, so possible that despite BTC not making any strong move in the near future altcoins can outperform in the next few days.
English