
damian
7K posts


$BTC, our big size long
And now, there is a 76% chance price doesn't even come back to our entry
Alright, weekend hit, time for a data analysis.
Because we took a rather controversial long, with size, in live time, telling you I took it with large size too, far above what I usually take. All with full transparency.
Probably one of the most controversial and backlash-heavy longs I took in a long time. Yet we have strong data to suggest we have a good chance that price will no longer come back to entry despite it not being too far away from it.
That's a bold claim, but I like bold claims and bold claims are the money shots in this game. In my own humble opinion, that is true for bold claims and bold claims only as long as they are backed by logic i.e. comfortable positions rarely work.
That is why I love countertrading twitter, even reputable influencers so much, because it is just so clear cut when it comes to crypto.
With that said, here's my next bold claim that there is a 76% chance price doesn't even come back below 94k (our entry).
Before you read further, no, I am not moving my stoploss to entry, I am keeping it where it originally was (see quoted tweet).
The data
Now let's get to it.
So on April 26th, we took a big size long and now it's stealthily moving up.
I told you that this is a 'quarterly position, yet you have to act quick on it'. Which means, the drawdown period won't be long, likely, and missing this one may lock you out of a potentially big move for an entire quarter long time.
Not just empty talk, every trade I take is based on hard-data to make sure we make money over time.
That is my blood sweat and tears and I appreciate every reader who appreciates that type of analysis.
Your efforts of just reading and consuming my content bring you closer to big crypto gains over time as many of you before have realized before.
This 'quarterly' position is not the first position I took. It's the 23rd time I take this type of position, paired with this type of analysis.
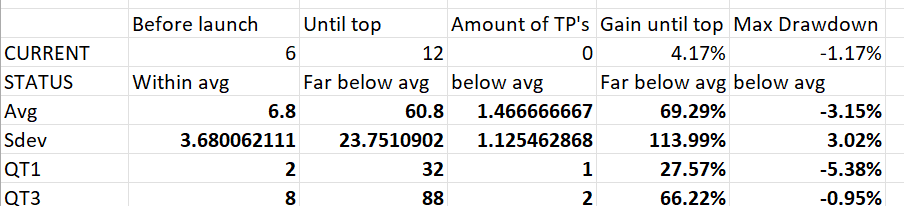
Details of every position I only share in my private grp but I am showing you here what matters: The 5 golden management parameters of every quarterly trade I take.
Time before launch (not coming back to entry), time until top (until the market tops, backtested in hindsight), amount of TP's I take, gain until top (how high it went after entry), and max drawdown after entry.
For each, I presented the average, sdev (how much variability), QT 1 (lower quartile i.e. the lower extreme) and QT 3 (upper quartile i.e. the upper extreme).
These are all the ones necessary to conclude that, given the average amount of days before price no longer comes back to entry, is 6.8 days, and given the weekend ranges and drifts up (I think it will), on Monday, that will be 12 days (from the time of typical entry, I know we took it a few days after that for micromanagement purposes but bear with me).
Indeed, that means there is a 76% chance price no longer comes back and indeed has launched off from our ground entry price.
It also shows us that the time until top is on average 60 days, which could be around July, perhaps (it's just an average, this is not a call here).
The only criticism is that the drawdown only was -1.17% which is half of what the expectations are on average.
But sometimes trades go that way and time is more important than price.
Conclusion; TLDR
So here you go, I just presented some of my own backtest data showing you why there is a solid chance price of $BTC doesn't even come back to entry and we are already comfortable. If true, that would be quick, and easy, and we just have to hold from now on until some good spots to TP. TP how high? on average 70% above here (not a call, just a projection on what to expect).
That would be oh so sweet if true and I can see why those chances are real, especially, given the backlash and criticism on twitter, how everyone called 94/95k 'resistance/be careful' while I was going full long right into it, and whilst even my own comment section doubted that call.
All power to you, but I'm holding this for reasons mentioned, reasons I hope make sense to you as well.
Thank you, good night
Happy weekend, everyone
Astronomer@astronomer_zero
$BTC Took a swing long with size in anticipation of a breakout. Target 1 is ATH Alright, stopped out of shorts, the only short we took this entire time. All good, it was half size and a playful move. Most importantly was to get out quick and set a clear SL in case price rips. Stopped out now, and you know what that means. Because the overall high timeframe plan is bullish, because we have been bullish ever since calling the very day of the bottom, and because we have been longing since, and finally, because the sentiment tells us the majority isn't ready to take a long in general, let alone a breakout like this, it's time to continue to play our bull market masterplan, of a $BTC led breakout first, and then, alt season. Starting with the $BTC led move, that is a breakout to new ATH. So I longed here, with stoploss below strong POI's which should not be broken if this is a breakout which I indeed believe it will turn into. The next POI if revisit that should hold is the upper purple POI in the high 80's. Note how this trade may take time, as we did plan the breakout to happen in June, and it also seems like a late long. So we may have some pullbacks. But I will hold this stubbornly until either invalidation or target. On top, I will still continue to take lower timeframe longs as well, this is a swing/positional long. So yes, this may feel like an unusual trade, and that's how breakout longs should feel like. But since we spent a very long time researching the bottom, called it, and now see everything we want to see for a move up, this is the play for me personally. So again, we may pull back locally. But in my book of risk management, missing a trade almost has the same implications as losing a few times in a row and so waiting for a pullback could be a mistake here. Hence why I am aggressive and longing with size here. We will see how it plays out, but this is my move, shared for transparency and educational purposes. Good luck if you trade along.
English
@xartoNz Waiting for the breakout long or backtest high 80's. I'll write up a plan in a few hours.
English
$BTC macro update
BTC took the window ✅ Watch this weekly close
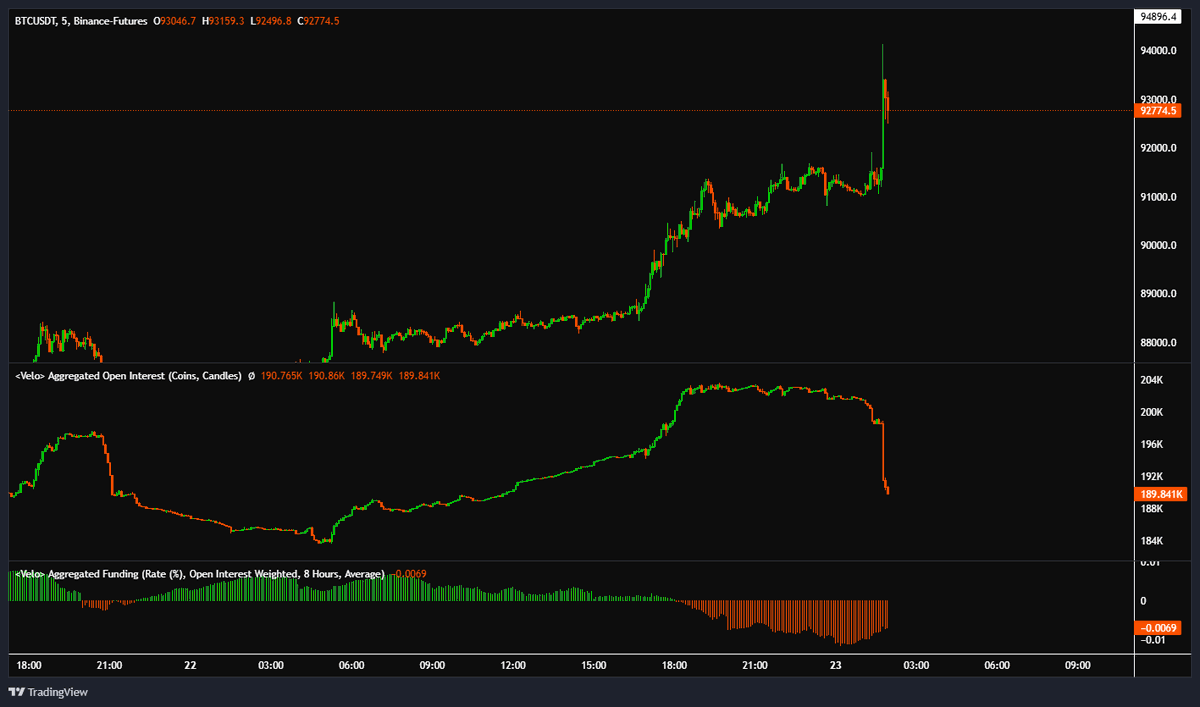
Alright, price is pushing up from the fifth major low we called in conjunction with our bull market master plan, now starting to look successful again with one weekly close away from confirmation.
With CVD maps fully skewed now, funding rates highly negative at almost every exchange, and TPO charts not moving balanced, it's as if almost no one wants to accept that the market can push up.
Indeed, $BTC is bullish generally, in a bull market. Even the most careful short I just attempted after waiting and taking only longs ever since we called the very day of the bottom (March 11th) is compromised, and that means something.
It means the market is strong. $BTC took the window and to confirm if we never revisit high 70's again this cycle, we need this week to close green and strong (above 90k, ideally), to fully confirm the reversal.
If that happens, we can congratulate ourselves for loading up spot bigtime again in the high 70's, to prepare for higher, indeed to new ath's.
I know it still sounds shocking, but new ath's are coming, and it's going to become more painful every week closer to June to see the breakout coming if you don't hold anything.
If you are not positioned, this weekly close could be used as the last resort time to pivot if you haven't bought the bottom with us, or follow along to time alt season (NFA, of course).
We will see how it plays out, but this is a very important move forward, against all the bears (essentially most of the population), and against all the ones who were calling this market to top out fully.

Astronomer@astronomer_zero
$BTC macro update The low held ✅ The window is open Alright, quick high timeframe update. But none the less, a very important high timeframe update as our high timeframe plan is continuing to play out and looking better and better every week. With the summer nearing, that breakout plan expected later this year is coming to fruition. Because at the time of posting, the world was against us when we called the bottom rather early (on March 11th) based on the chart below. Yes that was the very day of the first low and indeed, it has been swept. But you know my approach, of how I like to be early, and adopt the right bias as early as possible. Hence why we stopped going from mostly shorts and shifted to mostly longs and looking at buying spot again, ever since that day, now resulting in a back-to-back win, followed by a loss, followed by a three win streak since then on top of a comfortable distance from the time of flipping bullish and getting back in spot. And so the massive disbulief back at 77k, naturally results in a large and consensus 'surprise effect' when the market suddenly pumps now. I think that surprise effect is getting more evident and evident after every pump. Doesn't mean this is the breakout right here, right now. But it means the bull posting and massive spot accumulating, as well as holding the right bias without changing at any point, is paying off for us, and that green arrow will make bears being bearish at the bottom regret that for another full cycle of 24-32 weeks i.e., a very long time. So with not only the nature of this price action but also the general consensus and 'the surprise effect' of every pump from now on, that increases confidence in the fact this call is going to work out and we should indeed expect ATH and indeed expect that this cycle hasn't topped, which has big implications not to be underestimated. I mentioned I may finally take a short above 88k, and I still plan on doing that with some confirmation and a live call whenever the setup is ready. But this is and remains a countertrend trade, so please let that mid timeframe trade not confuse you with this high timeframe bias, and the main idea remains to stay bullish and expect new ATH's and remain positioned for that, as I have been saying over and over and over ever since March 11th. So yes, if a short triggers and I give the live call, that is my entry. But that is within the context of a high timeframe bullish bias, i.e., that is just a short in the sea of many longs, and that also means I am not selling any spot, as ATH is indeed coming and this idea, on top of all analysis prior, is holding. And that is very nice to see. We are all in crypto to make money by mostly holding in the 2023-2025 + 4 *x rotation years (and only mostly shorting the market in the 2026 + 4x, with x = 0, 1, 2, 3 ... rotation), growing the asset class over the years and providing large positional trades both ways. Always shaped by high timeframe analysis and the big picture, just like this one. Keeping that in mind, every trade we take.
English
@astronomer_zero @exitpumpBTC DM’s bro please, my last attempt at it. thanks
English

Added position here, plan to exit early and remaining bullish overall.
Alright, price pushed higher.
I know the trade is still valid, but personally, I'm just not that bearish on high timeframes and want to focus on our overall bullish plan.
So, I'm just planning on exiting this trade, if possible, break even and letting it do its thing.
Yes it might still drop hard and reject, and the right move is probably to just hold and let it ride.
But with our high timeframe plan shining as if the Egyptian God Ra was in control, I'm just not the one to join the bear crowd with any conviction.
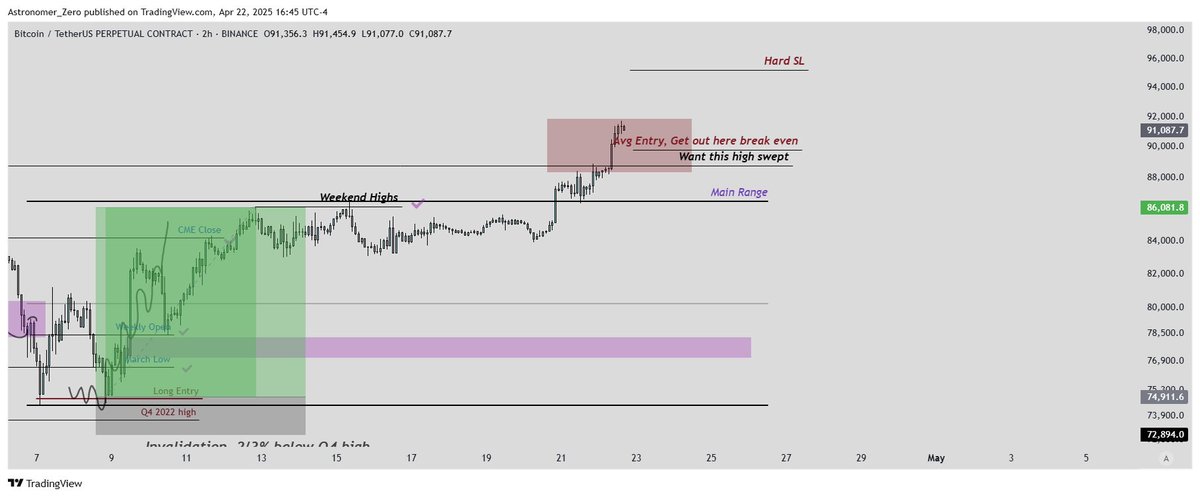
So trade was only quarter size, now doubled it up to half size.
Entered the first part of the short at 88.5k, and doubled size just at 91.1k, so average entry is now 89.8k.
I have set a hard SL at 95k, so if it hits that, it turns into a loss. And I have set a full limit TP at 89.7k, so if it hits that, it turns into a break even.
So that's the plan, indeed trying to get out of this trade break even, laid out here with full transparency, and upon any price drop, looking for a long instead.
I just can't join the bears properly this time, as I've been bullish ever since the March 11th with conviction, and find it tough to hold what IMO is the most crowded trade now (to short), especially since I have no edge for a drop, which is also very telling, typically.
So with that, I intend to abandon this trade and idea, and continue to appreciate all the upside price action in conjunction with our overall bull market master plan.
Astronomer@astronomer_zero
Our high is swept✅, I'm bullish high timeframe, but I'm short here per plan (quarter of normal size), second entry around 90k during NYO today or Tomorrow Alright, we waited long enough and let our plan fully develop. We closed a long just slightly below these prices and are at a big point of resistance with all details laid out of both why 88.7k would likely be visited, but also why it has a chance to reject. Keep in mind that this is a countertrend move, and that I am high timeframe bullish and absolutely loving this move. But one short attempt doesn't hurt and the RR has shaped up here so despite the lower hit rate this type of trade has, it's worth it for me to exert a small punt. I will be holding quarter size all the way through and semi stubbornly up to limited invalidation of 95k (hard stop), soft invalidation just over 90k. This is an early entry, and so it can trade higher before reversal, so I will add another quarter size on today's NYO, or if price slows, on Tomorrows NYO. If either of NYO's are too strong, or if both are wrong, at that point, I will be looking for an early breakout positional long for fresh ATH's and beyond. But until then, this is the only short I would take so here is the punt. Enjoy and go easy on this one.
English
Our high is swept✅, I'm bullish high timeframe, but I'm short here per plan (quarter of normal size), second entry around 90k during NYO today or Tomorrow
Alright, we waited long enough and let our plan fully develop.
We closed a long just slightly below these prices and are at a big point of resistance with all details laid out of both why 88.7k would likely be visited, but also why it has a chance to reject.
Keep in mind that this is a countertrend move, and that I am high timeframe bullish and absolutely loving this move. But one short attempt doesn't hurt and the RR has shaped up here so despite the lower hit rate this type of trade has, it's worth it for me to exert a small punt.
I will be holding quarter size all the way through and semi stubbornly up to limited invalidation of 95k (hard stop), soft invalidation just over 90k.
This is an early entry, and so it can trade higher before reversal, so I will add another quarter size on today's NYO, or if price slows, on Tomorrows NYO.
If either of NYO's are too strong, or if both are wrong, at that point, I will be looking for an early breakout positional long for fresh ATH's and beyond.
But until then, this is the only short I would take so here is the punt. Enjoy and go easy on this one.

Astronomer@astronomer_zero
$BTC 88k reached ✅, short plan updated: still holding off on the short, riding spot bags up for now. Alright, nice, 88k reached and so we come near our first big area of interest again ever since we called the bottom. Now before you start spamming the short button, I personally am not short yet and approaching this one conservatively as mentioned (but feel free, this is just NFA...). Reasons are mentioned before and simple, repeated here: my overall bias is bullish ever since hitting 77k on March 11th, and so the main focus is longs, with more aggression and frequency than shorts as you know. Also still seeing a lot of disbullief and 'caution' upon this price rise, which is not great for bears, great for us, not great for the short (yet). It's also past 10 am New York time which is not a time to be expecting a reversal either generally. There are also no large sell walls and CVD aggression is also still rather whale green - retail red. Finally, now that we reached the 88k area we wanted to see, I can specify now that I would want the 88.7 k level swept before pulling the trigger. Once all that happened, Some local distribution and whales at least giving up or at the very least pushing price into their own asks on causing CVD divs on Binance is what I would want to see for a local reversal back to the lower 80's. We do have the weekly open below as a first magnet, and if this does turn out to be a deviation, that would require a close back inside the range on the backbone of a bearish weekly candle, which means Tuesday or Wednesday, price would have to reverse. So seeing signs of a fake pump on Tuesday or Wednesday would be ideal which is what I am looking for in conjunction of the painted scenario above 88.7 k. As long as there are no signs on that occurring, shorting here is blind for me and I would rather ride up our spot bags in conjunction with our bull market master plan of calling yet another major low recently, very close to the actual event. If I miss it, all good, I'll gladly long the midrange area with aggression and size, as we have been doing with our longs, scoring three wins in a row so far again. With that, I have given the plan for a short indeed with a cautious tone and some additional conditions before pulling the trigger. So we'll see if they get fulfilled. Do not worry, I will call out live when I take the short as always. No vagueness, no fake entries, only real and live time calls. Enjoy the update. Questions below.
English
$BTC.D and alt season
There is the sweep ✅ close back below the wick and alt season begins
Alright, not two days ago, we planned to see a sweep of the wick, as, that wick has been set rapidly on a ranging $BTC day. That also typically means that wick gets swept and revisited on a trending $BTC day (high liquidity injection) as we mentioned.
Because our overall bias on $BTC is bullish on the high timeframes and because that timeframe matches the timeframe of this $BTC.D chart along with our projections, I continue to expect this to become a fake rally above this wick.
If given that would result in nice synchronized three drive on the weekly timeframe.
So in short, the $BTC push off the bottom we wanted to see is taking place. It's dragging up $BTC.D with it which is what we also wanted to see (a $BTC led move up).
What we want to see next is continued sideways and bullish price action on the $BTC weekly with continued upside on $BTC.D.
As $BTC gets further into its breakout leg, this move up on $BTC.D should slow down, finishing the move up and finishing the fake rally/ failed auction above the wick.
That confirms both the breakout of one of the final legs of $BTC, along with the grande altcoin catchup towards the end of the year.
When will this happen, and how fast? That fully depends on when $BTC will break out.
We have estimated that to be late spring, early summer. But of course that can differ and the closer we get, the easier to predict. (But don't worry, price doesn't run until the actual breakout happens, and there will be a plethora of traders doubting the rally just like in October/November).
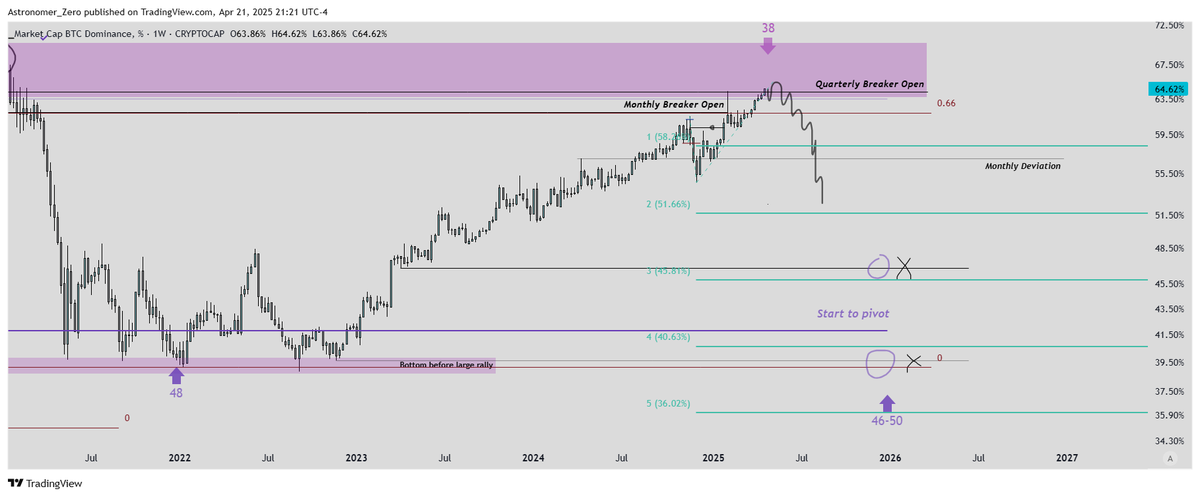
Just know that the $BTC bottom is in, we called that, and that can not be underestimated.
So a delay or not, that only results in more pain in the time dimension, not the price dimension, as indeed, $BTC.D is back at 64.60%, high and dry, and no matter how long it stays there, according to the analysis (and chart, given prior), it will find a tough time to climb much higher, before ultimately coming back down fast, in the same fashion we have seen a warm-up of in October and November.
Astronomer@astronomer_zero
$BTC.D and alt season update + an alt season plan Our sweep is coming, once it's done, alt season is set up Time for an update on $BTC.D, still, slowly drifting up for just over 2.5 years now. In the 3-1 (4) year cycle format, that is still within the normal and expected timeframes of $BTC.D uptrends. Admittedly, the wait is getting excruciating at this point, but can't stress enough how 'the longer the wait, the stronger the move' holds here. 'Patience pays' Patience pays indeed, we know that, a four yearly reversal takes time, and so timing the micro top effectively is challenging based on time and high timeframe POI's alone, as, while $BTC.D slowly rises, alts bleed a lot harder, especially if they are only short term one-hit wonder type altcoins. That is why we have been focusing heavily on $BTC and $BTC only, trading up our accounts to accumulate as much capital, before a clear pivot in focus on altcoins. We had a warm-up of that during October and November but had to put it on hold based on analysis at the time, but as for any warm-up, there is a main exercise. So with this post, just a reminder that I am looking to pivot at the right time, as, unlike the $BTC maxis, I do think alts are worth catching, where the biggest gains are had (as a consequence of the longest wait, very clear now), and so they are a useful tool to boost capital if played correctly. In short, the risk is well worth the reward. So to do that effectively, with this post, I attempt an analysis on 'when alt season' as well an actual plan on how to play it. The latter is important yet funnily enough, with a lack of posts involved on this platform. Analysis Analysis comes first, and not much changed from last post, where we said '65% area is the top, but expect a sweep'. We're now seeing that sweep. But other than that, we still are in the exact POI we want to see a reversal, as well as, if the sweep occurs, at a cyclical time of 38 months deep into the cycle, pushing it far, but still a typical point for reversal. Also still at the 0.66 fib level retracement, and some important high timeframe key levels on the quarterly and monthly timeframes, i.e., powerful timeframes. Once that has taken place, I simply want to see a monthly close of both April and May below the Feb wick high. That completes the setup for alt season. How that sweep occurs and what direction $BTC takes on at the time, I am not sure yet. But ideally, it would be a $BTC led move as $BTC.D makes its final push, which continues the typical 2017 playbook we have been exploiting all of 2023 and 2024 so far. Targets remain time based (month 48-50), but with the length of the wait, likely a sweep of the entire range. So hopes for sub 40% are realistic, although a good conservative target is 45%. Plan So most importantly, how to play this? Firstly, I personally play spot only on alts and only after a confirmed trend (typically, $BTC led with a final $BTC.D squeeze, as mentioned), put in sizeable longs, the most logical approach. It already takes a lot of research and energy to both find the right type of coins let alone analyze all charts in detail. So spot is the most key to play right because if spot fails there is no 'bonus' to playing leverage IMO. To plan for spot, it makes sense to look how altcoins this cycle are doing, before expecting what they will continue to do, especially true for top 100 coins over 3 or 4 years old (not talking about altcoin trenches here, that would take a long post to write and I don't spam PnD's). Use that move of October/November last year, and extend the trend down from the expected sweep and that gives some projections to which alts to choose. If the alts you like have put in 50% move at that time (of $BTC.D going from 61.5% to 55%), that means they likely put in another 50% move from where they are now once $BTC.D reaches the 1-to-1 extension (currently at 58.27%), and a 100% move at 51.66% If an alt you have your eye on did a 100% move in October, then that would mean another 100% move from current price and a 200% move respectively when $BTC.D reaches 51.66%. With this type of targeting, you know what to expect when placing your bets. Which helps to project what risk you tolerate. Because smaller coins often put in bigger moves, bigger coins, smaller moves. But smaller coins carry the risk of bleeding more until the top on $BTC.D is in, which is the risk and reward in catching alt season. So combined with some basic fundamentals (does the team have an active github, is the fanbase and project established and is there a narrative to push price harder?), using this risk/reward as a baseline to see which coins will skewed away from the risk side and more towards the reward side and compare it to October/November, is to me an effective way to select the right bags, even if the timing isn't perfect. Aside from that tactic, based on your own risk parameters, it also makes sense to select either bigger coins or smaller. Typically (but not always), with more capital, it makes sense to avoid risk (look at the coins who bled the least during this bear market), and lower capital, typically means looking at the reward side more than the risk side (bleeding bags hurt less in absolute terms over big capital), thus typically position in smaller coins (top 100-300). Summary So with this post, I have not only given a reason why it's worth to position for alt season, but also roughly told you when, and how to position (NFA), which is more important than just some lines on a chart to maximize reward and minimize risk, as both are very prominent for altcoins. Enjoy.
English
Another piece of advice I often give before entering a trade, is to only enter the trade if it is a potential power loss.
A 'power loss' means that whenever you lose the trade, the market is in a better position to take advantage of.
That doesn't mean prices have to be lower if you were long or high if you were short. It could also be related to timing 'if we make a new low and I take a loss, the cyclical timing is even more attractive to long again'.
Or 'if I lose this long, the market is finally low enough to buy heavy on spot, so I won't miss out on this cycle despite arriving late'
Or 'if I take a loss because of a range sweep below or above my SL, that sets the range up in a range-sweep setup with an excessive length, i.e. an even stronger and higher probability trade'.
Or 'If I hedge $BTC short here and take a loss, I can sell my altcoin spot bags for high prices because a push right now is exactly what the market needs to trigger altcoin season'.
The loss of your trade puts the market in a more powerful position, your trade is a potential power loss.
Those trades are great, because it allows a second attempt, and because edge sharpens upon the loss, you can apply touches of profitable russian roulette techniques.
It also strengthens the mentality of being stubborn at you high timeframe bias, preventing you to flip flop or mix low timeframe emotions with high timeframe structure.
So keeping this in mind ads that extra dimension of strategy to your system, not often talked about.
And it also explains why I am selective about my trades, but also 'aggressive at the right time'.
If I win, my frequency is lower (not gambling away profits) if I lose, I trade a few more with increased edge, so overall, I take trades regularly at the most strategic times possible at all times.
English

"BTC is correlated to the S&P 500 Stock market"
Then explain to me how:
Covid crash: US stocks went -35%, $BTC -65%.
2022: US stocks went -26%, $BTC -77%
Recently: US stocks -23%, $BTC -30%.
The ratios of the drops of each are 1.85, 2.96 and 1.30, plot these on a graph and a scientist will say your data is useless.
Expecting stocks to drop hard is not a valid reason to expect $BTC to drop hard, or vice versa.
Sometimes $BTC drops hard, stocks don't, sometimes stock drop hard, $BTC doesn't.
With that said, the timing does align most of the time for downsides. But that is because all market cycles are aligned and intertwined.
And for those reasons, I do not factor in stocks, it only complicates the analysis, and creates excuses to take or not take a position or blame your loss on that.
Don't like excuses like that. If I win, I celebrate and take the money, if I lose, I admit it and take the loss.
My humble opinion.
English
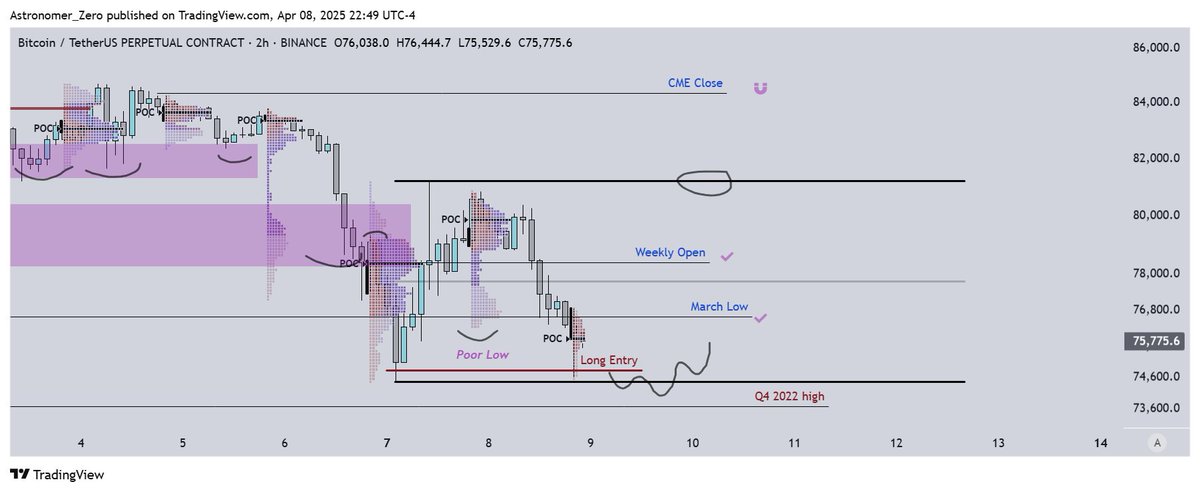
$BTC
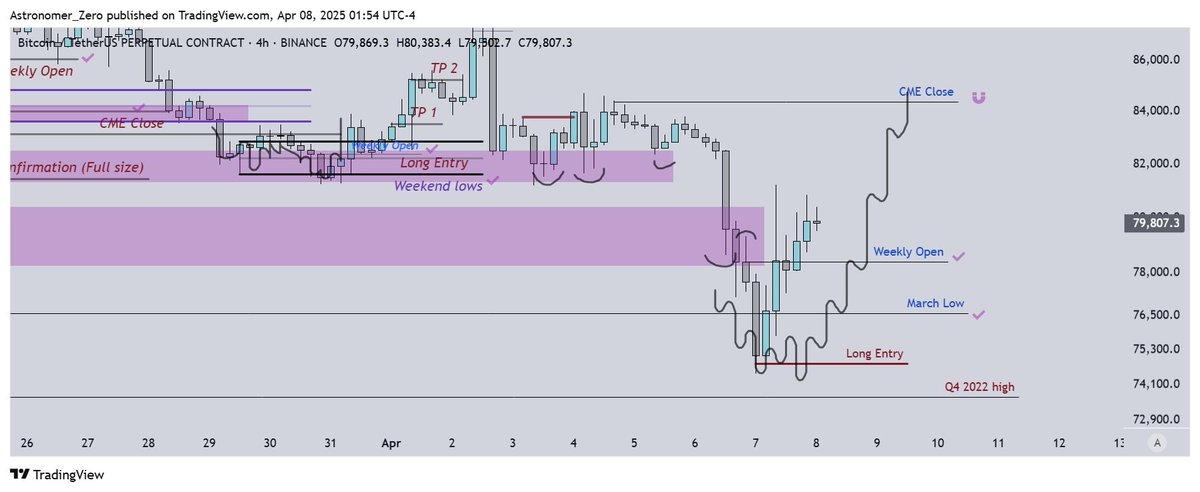
TP'd near the top ✅, range forming, looking to add back in again near range lows. Target 84k
Nice, move up from 74.7k largely played out and our aggressive TP's have been rewarded with a nice retrace after hitting 81k.
Suggested this retrace would happen and I also suggested, if you are out of position, to start entering at the 0.5 fib, based on the poor lows on the TPO and an array of late longs into the 81k level.
If you started longing, great. I personally also still hold the other 50% of my long for the 84k target.
TPO chart is now balanced, CVD's scaling up again on the whale side especially on the coinbase playing field, which are generally higher quality buyers than bybit and binance (whales are often late longers). On top, big walls again below with obscurity enough for them to not be spoofs (chaotic walls).
So that's great confluence for another long. If you already started, I think range lows is a great spot to add, where I also look to add once again.
So this post serves as both a reminder to hold the remainder of the longs we took at 74.7 k and to expect 84k, based on the bullish bias for the reasons given.
Astronomer@astronomer_zero
$BTC longs 𝐖𝐞𝐞𝐤𝐥𝐲 𝐨𝐩𝐞𝐧 𝐡𝐢𝐭 ✅ 𝐫𝐞𝐜𝐥𝐚𝐢𝐦 𝐜𝐨𝐦𝐩𝐥𝐞𝐭𝐞✅, 𝐛𝐢𝐠 𝐭𝐚𝐫𝐠𝐞𝐭 𝐡𝐞𝐫𝐞 Price trading higher after longing the exact bottom in live time, in the midst of a timeline of max bear celebration once again. 'The celebration of just a sweep lower' Because indeed all they had to celebrate for ended up just a fake-out below the March low before instantly reversing. Funny to see because they get no chance to flip or enter as the bounce is high before even giving a retest. Good for us, we longed at a time when the candle going down not even moved up a single hair, a complete knife catch. Yet the trade so far results into nearly zero drawdown and a 5% move back up in hours, probably one of the cleanest longs we had in a long time. Thank you $BTC, second TP here (Another 25%), right at weekly open which was one of our targets. That also completes the reclaim, and yet again puts that initial schock to everyone waiting for 70, 65 or even 60k that it likely does not happen as per our htf thesis, price suddenly reversing right before it each and every time, great for long entries and a good pay. It's a kind of magic.
English
@seth_fin @originaldern Not looking good for most coins can’t lie. Futures already tanking again too
English

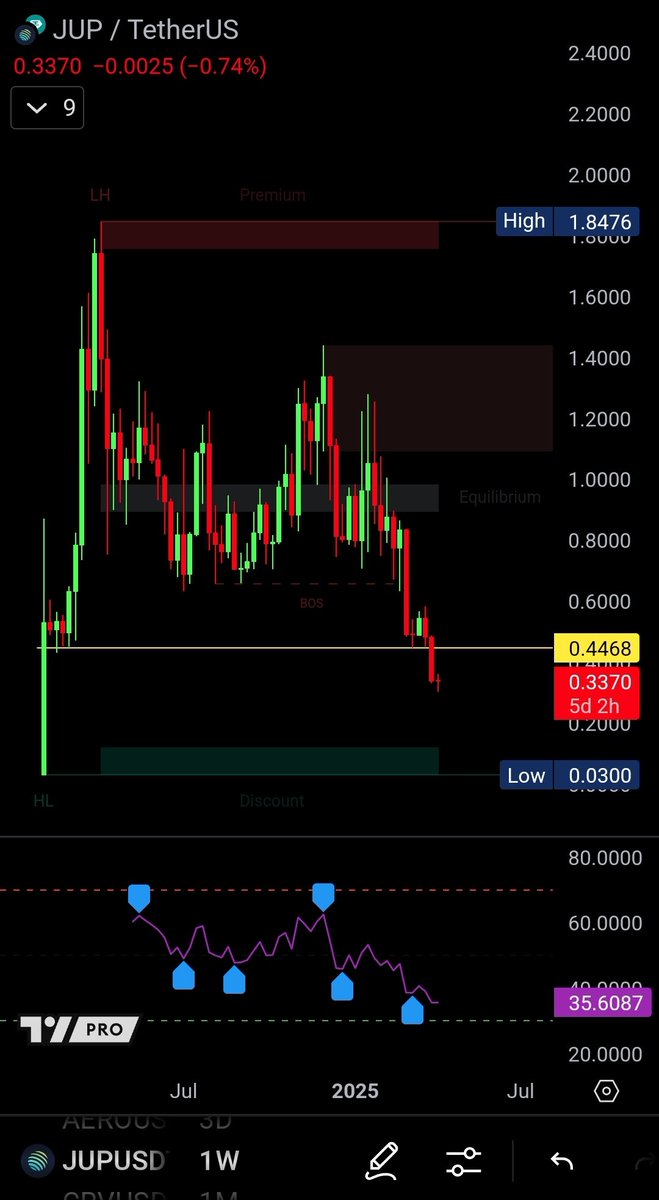
@originaldern Very hard to say anything about $JUP
It just lost another support.
I wouldn't buy right now. Need to see it make some kind of bottom pattern. Need to see trend reversal.
English
🚨🚨🚨🚨🚨
BREAKING! 🇺🇲 WHITE HOUSE SAYS AN ADDITIONAL 104% TARIFFS ON CHINA WAS APPLIED. 😳
#TrumpTariffs #stockmarketcrash
Seth@seth_fin
🚨🚨🚨🚨 $SPY -1.52% $QQQ -1.75% #Stockmarket was green +3% before the tariffs press conference from the white house. You tired of winning yet? 😏
English
@astronomer_zero Thanks fam. Whats the SL/inval on the remainder? Out of curiosity
English
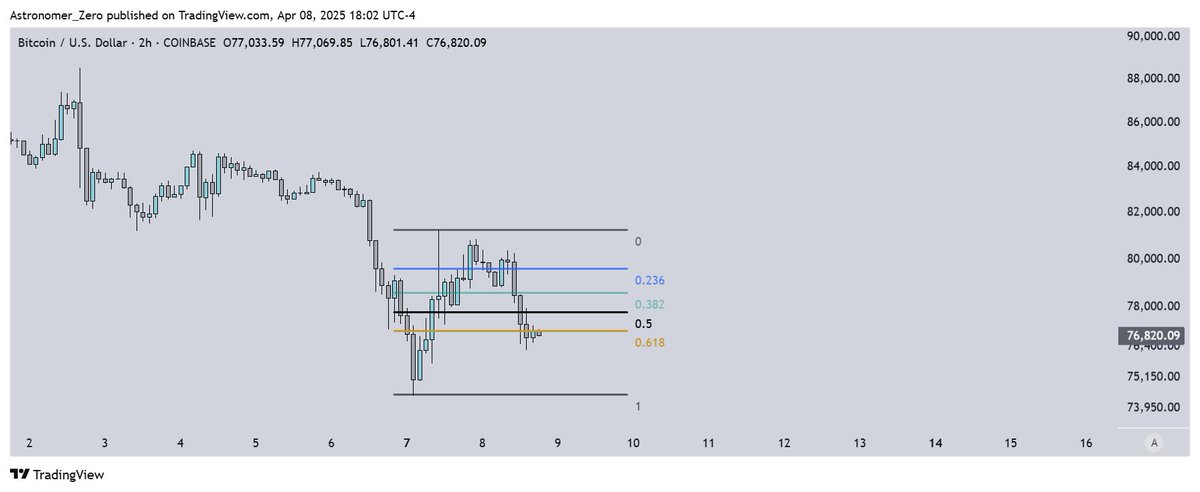
$BTC
That was quick, the before and the after ✅
Quick review of what happened with the $BTC price today and how we acted on it and made a rather quick gain.
Think I'm allowed to because we caught it in live time, tweeted almost the very minute the low was set and so there is zero hindsight and a review like this only ads value as we went through the process step by step from start to finish.
It was important for me to act on it as indeed, a quick move is nice to be part of and volatility is what traders (such as myself) like.
And it goes to show that was soon as both the CME gap, and weekly open stretch out far above, as well as the second week creates a fake move down on the open, as well as the local orders being skewed smart money buy, small money sell, as well as the overall bullish bias we spend weeks and weeks on to figure out and analyze, that is a trade worth taking every day of the week, and so we did.
And so this trade also shows that our expectations of our bullish bias remaining in tact, indeed hold with this reclaim.
It was indeed a lower low, not a higher low, but the market was fortunate enough to give away its plot by showing us her hand on Monday which is the day we waited for to nail this very long.
Next target is still 84k, and I fully expect that to come around. The week is still young and if it's not a sideways one, it's likely a bullish one IMO.
If not positioned yet and you missed my post or you just found my page, I recommend waiting for a classic 0.5 retrace of this drop (nfa).
Thanks $BTC once again for leading the show, it was a pleasure to be on board.
Astronomer@astronomer_zero
$BTC Lows taken out ✅, took initial long here Alright, we are below the low now. I know I said I would wait for Monday's close. But weekly open above is stretching far and lows are taken out with a large burst of liquidations + all analysis given prior still valid. We also hit our -1 sdev target of our hash ribbon analysis, and Q4 2024 high coming up. Could end up being front run as we often see so happy to start the long here. This is an aggressive long in anticipation of the low being reclaimed. But I mentioned why I think it will reclaim and thus being in position makes it easier to manage the trade later on. Added bonus is that this probably freshens up the timeline for you as I don't see anyone calling trades here in a situation that might very well be the most interesting prices for a long time. This is also a half size bet of what I usually take, to be able to manage the way through. If this long turns a loss, that's also with big repercussions for the rest of the cycle. So it's a last long standing, one I have to take in my book.
English
@mackeydee88 @lance61410305 @astronomer_zero @imtrace0 Sorry can u confirm the prices at the 0.5 and 0.618? Thx
English

@lance61410305 @astronomer_zero @imtrace0 I’d assume a 0.5 from yesterday’s high to yesterday’s low. I might try to be a bit greedy and aim for the 0.618 but probs won’t get it
English


Many peeps are asking me why I’m targeting 68-72k now that 81.1k has become resistence. This is why… $btc
PappyVanCrypto🌵@PappyVanCrypto9
@ZachLucasKing @AzzySh215690 Even LBBW1 69.5k is a breakout retest….see for yourself… $btc
English
Not sure. To figure that out I just wait out Monday, see if its a gigantic red Monday, neutral, or a green one.
If its a red Monday, just going to long aggressively
If its a green Monday, long weekly open retest or close to.
If its a neutral Monday, play Mondays range, longing below.
For starters.
In terms of spot, yeah good to buy regardless and look to position largely.
English
$BTC - When moon?
Bottom call complete✅,the higher low likely comes mid April, and the breakout late May or begin June
So, last data analysis, we called the bottom with 94.4% certainty (one that we bet on), and, as funny as it is how many serious accounts on here still act carefully, don't dare to call a highly confident bottom, or have gone quiet, all against many of my analyses, one of which I shared on X.
We kept at it with the bullish stance. And the bottom still held so far.
With that completed, another aspect to look at is when the worst part of the bottom formation process follows (the retest or higher low), and when the breakout follows (the point of no return).
In October '23 and '24, we performed a similar process, with calling the bottom first, the higher low second, and the breakout next. And today, all feels eerily similar, and I intend to do the exact same, of calling when the higher low comes and when the breakout comes.
With this post, just one of the many ways I look at the chart to come to a conclusion. And according to this analysis (using the hash ribbons and assuming miners as still a powerful horde, explained why in the quoted tweet), it won't be too long before we no longer see prices this low anymore.
How to know? Charts represent both price and time. And as we already gave an example of how to analyze price in last post and managed to call the bottom, it's also possible to analyze time of when the move(s) in price happen(s). Often forgotten, which is why I like it so much and often value time over price. "If you don't always know where price will go, just try to know when it will go". (The seasoned trader does both and spreads his bets over both).
So in this case, simply collecting every single time (how many weeks after) the price bottomed after the hash ribbons signal flashed, and every single time (how many weeks after) the price never returned to the price of the time the signal went off, and taking the average, you already get a good idea of when the low will come.
And according to my calculations, the average time of the largest drawdown after every signal is 3.12 weeks (sdev 2.47 weeks), and of the point of no return is 9.47 weeks (sdev 9.12 weeks).
An example of how I found the largest drawdown after the signal is shown on the left of the chart (at the prior signal), as well as how to find the point of no return.
Do this for every signal except for the covid low crash (black swan) for the entire history of $BTC, and calculate the average and standard deviation, you should get a similar number.
I also added weights to each signal because recent data is more important than old data, yet the differences between giving everything the weight of 1 or a linear increase is no big difference.
So with that data, you know to expect the low to happen mid April, and the breakout somewhere in May or June.
Also note that "the low" does not mean new lows. It simply means "the lowest price after the signal flashed". The signal flashed at 82404, so 79878 would not make new lows but classifies as a potential low after the signal flash. In many cases, the low was the week after and price simply never returned.
So, clear data, from a unique viewpoint. Would be funny if it plays out because not many expect a low now or the low already being in, nor do they dare to say it, and if it goes well, then many would be screaming "sell in May, go away". Something that didn't work in 2017 either by a long shot.
We shall see, but this is one of the pages in my book.
Summary
So with this analysis, this is one of the many confluences out there trying to time when $BTC will be done ranging, when it will move to its extreme lows of the range, and when it will break the range. This also clarifies the direction of the break, it indeed likely breaking up, not down.
And so this analysis is also a reminder to analyze not only price, but also time. Because you could be right on thinking it goes up, but forget to position because time ran out and you turned impatient.
And analysis != execution.
It's easy for an influencer to quote an old tweet whenever they see fit, but who actually calls live or has the capability to do so? Not many according to the order books and CVD data of most of the large CEX.
Final disclaimer, this is not the only way to base your thoughts on when to expect price to move up, it's recommended to use as many confluences as possible (as do I), to not only refine down your timing, but also confidence. So this is just one example of a simple way on how to go about it, with the added value of it supporting what I have been saying ever since the day of the very bottom, we indeed called on March 11th with an obvious tweet.
Thank you and enjoy.

Astronomer@astronomer_zero
$BTC And now, the chance $BTC has bottomed is 94.44% on a wick basis, and 100% on a candle closing basis Alright, here we are, another data analysis, confirming our bottom call at the very day of the exact bottom (11th of March, see quoted tweet). For the ones who just found out about me or just tuned back in to crypto, this is one of the (many) conformations of the bottom we called very early on at 79.8k before most of these signals even triggered. The call, then perceived as a 'knife catch', has now had major traders doubt their bearish bias, influencing hundreds of thousands of people, the wrong way, as there are many out there. And there still are many out there, along with the sentiment of the public, and in the midst of another classic signal which always seems to flash at the right time. One I value highly and have learnt to exploit correctly in confluence with other secrets over the years and make a lot of surplus gains on compared to the 'just holders', especially date Today. So here, another signal arrived, supporting my bullish bias, and why I will continue to look for longs only, a strategy we adopted since hitting 77k. Not to gain a one sided bias, but just to represent the data as is as there are no data sets even coming close in terms of significance to signifying a breakdown of this local range to the downside (the bear case) over a breakout to the upside (the bull case). But as always feel free to come up with them and counter my argument. The logic behind the hash ribbons, I have explained before (just search my name and hash ribbons on X). But in short: each time a cross up happens, a blue buy signal flashes. This comes from an increase of the hash rate after a steep drop i.e. a compromise of the networks hash rate, which means the weakest (Pareto's principle in Economics) mining businesses shutting down/getting liquidated in a corporate way, or lowering electric power. That corporate capitulation creates a low. And in a world of sharks, where weak companies exit, stronger ones (new or already existing) see opportunity, and take over the spot, rising the hash rate i.e. The confirmation of the low, a blue buy signal. Yes, I said the word 'miners'. Not sure why no one ever talks about miners anymore, or why the fundamentalists tracking them are mocked so often. They are still important whether you want it or not. As simple math explains: 6 blocks mined/hour (on average). Which means per month, 622,080 BTC are provided into the hands of the miners, which is more than Saylor's (our biggest holder) entire stack still to this day (about 500,000 BTC at the time of writing this post). That also explains why $BTC sometimes feels like it is in lockstep with the stock market (shares dropping, mining companies rotating assets), and other days, it 'decouples' (due to the miners drive). Not going in depth here, but the numbers above explain enough, as well as a simple check to what most of the cold storage does and where it comes from. The data So that's great logic, not many people know or like to share. But what does the data say ? Well, the bears won't like this one, as on a wick basis, 17 out of 18 signals worked, and price never returning, until a new ATH (or never) after a drawdown of 10.7% on average and a standard deviation of 11.1%, The only time it failed was due to the covid wick. On a closing basis, it worked every time so far (covid weekly candle closed up high, bought up by miners), with price never ever returning, until ATH (or never) after a drawdown of on average only 5.28%, sdev of 7.79%. So, that is powerful data, from a very significant (the most significant) capitalistic power source on the $BTC price. Summary And so that confirms the low we called on the very day of the low (March 11th), rather early and before anyone else did mainstream, once more. And many of those (certainly the majority) is still either calling for lower, or protecting themselves with 'only going long after a reclaim, be careful guys' with no live call ever, only wins to share after price goes up (the Houdini trader). I'm happy to share live data, along with live calls upon them, without a paywall, and with a premise to take you in the direction of making you money over a showboat mentality and promoting a bad private group (standards are higher, as necessary in my honest opinion). I have quite a lot more of these analyses ready. But this one is easy to interpret and understand. Enjoy.
English
@notgointomakeit @astronomer_zero Cycles Over at that point anyway. Good luck.
English

@astronomer_zero @damiannfcb If you’re wrong and we just nuke to like 50k BTC how would you play it
English