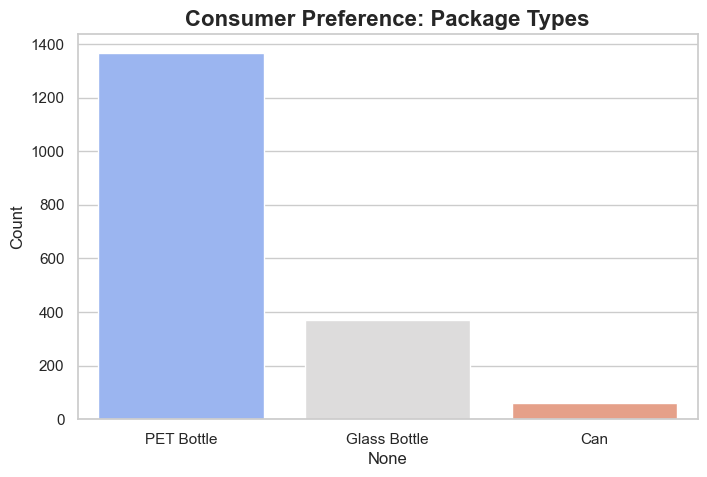
Nervs

51 posts

Nervs banner
Nervs

Nervs

@getnervs

Shaping future cities with geospatial insights

Lagos Katılım Kasım 2023
1 Takip Edilen71 Takipçiler
Nervs retweetledi
Google Earth
Google Earth@googleearth·
Reliable data is the foundation of geospatial work. But gathering it shouldn't require expensive, time-consuming site visits. ⏱️ Google Earth’s data layers just went global. We’ve massively expanded access to geospatial data with global coverage of popular layers and adding entirely new data layers: 🌊 Inundation history (1999-2020) 🚴 Global cycling trip percentages ⛰️ 20m elevation contours Explore these new data layers, now. 👉 goo.gle/4lO1g80
English
8
61
330
17.1K
Nervs
Nervs@getnervs·
🎉 SUBMISSION CLOSED! 🎉 ​A huge thank you to everyone who participated in the Nervs Data Challenge. Your engagements have been incredible. ​All participants will be contacted via e-mail soon with the next steps. Stay tuned! ​#Nervs #NervsDataChallenge #DataAnalytics
Nervs tweet media
English
3
2
14
594
Nervs
Nervs@getnervs·
@Gbem1ga You still have till 11:59pm tonight. Hurry!
English
0
0
0
20
Nervs retweetledi
BJ The Analyst
BJ The Analyst@H__abdulahi·
#NervsDataChallenge Was almost late to the party A soft drink dashboard, showing consumers behaviors across different brands and products, by product type (category), purchase location, package type etc.. This dashboard can inform or support decision making. @getnervs
BJ The Analyst tweet media
English
0
1
4
340
Nervs retweetledi
Hamad Kamorudeen
Hamad Kamorudeen@hamadkamorudee·
I analyzed the soft drink market in Alimosho Lagos and found a shocker: It’s not about supermarkets. 86% of sales happen in small, informal shops. Coca-Cola & Pepsi lead, but American Cola is #4 and 76% PET Bottles vs 3% Cans. #NervsDataChallenge @getnervs @ezekiel_aleke
Hamad Kamorudeen tweet mediaHamad Kamorudeen tweet mediaHamad Kamorudeen tweet mediaHamad Kamorudeen tweet media
English
0
3
9
1.1K
Nervs retweetledi
EBΞN
EBΞN@BigTots_03·
• Geo-mapping (latitude/longitude) highlights density of sales across locations. Data cleaned in Excel, visualized in Power BI. Turning raw data into actionable insights. #NervsDataChallenge
English
0
1
5
231
Nervs retweetledi
Divine📊📉
Divine📊📉@divi34228·
Hi everyone😊, I just submitted my dashboard for the Nervs Softdrink distribution challenge. Take a look at my final dashboard it covers the product distribution,competition, and consumer trends According to my Coca-Cola is the leading product 👌 wow #NervsDataChallenge
Divine📊📉 tweet mediaDivine📊📉 tweet mediaDivine📊📉 tweet media
English
2
5
6
377
Nervs retweetledi
Oluwatosin Adebayo
Oluwatosin Adebayo@Oluwatosin40244·
Just concluded a very insightful and inspiring project from @getnervs challenge. Working with a real data set in the past few days was so overwhelming. Check out my excel dashboard. You can also check out my github for other tools I make use github.com/Oluwatosin2123…
Oluwatosin Adebayo tweet media
English
0
1
2
143
Nervs retweetledi
OLAJIDE
OLAJIDE@jickson234·
Regarding the map visual that wasn’t displaying correctly, my Power BI account had certain restrictions that affected map usage. I suspect it’s because I’m using a free account. Interestingly, once I logged out, the map started working perfectly. I’ve included the dashboard screenshot below, along with the link to the GitHub repository. github.com/Kolawoleolajid…
OLAJIDE tweet mediaOLAJIDE tweet mediaOLAJIDE tweet media
English
0
1
1
197
Nervs retweetledi
OLAJIDE
OLAJIDE@jickson234·
Over the past week, I worked on a fascinating soft drink market dataset, and the insights were incredibly revealing. After unpivoting the data, cleaning it, and modeling it in Power BI, I built a dashboard that exposed the real story behind brand performance in the market. Here’s what I discovered: Coca-Cola isn’t just popular, it absolutely dominates the market, showing 68.5% penetration across outlets. This level of visibility doesn’t happen by chance. It happens because Coca-Cola is almost always present, always displayed, and always accessible. Pepsi follows closely, proving just how competitive the space is. But not all brands enjoy this advantage. Mountain Dew, for example, has the lowest visibility in the entire dataset. Why? Because it barely appears in most outlets, only kiosks and shops. In a market where distribution equals visibility, this was a major weakness. Fayrouz had a similar challenge. When I analyzed display strategy, the picture became even clearer. Over 927 outlets use the display stand, making it the most powerful visibility tool. Brands that dominated the display stand, like Coca-Cola also dominated in market presence. Packaging was another interesting insight: PET bottles accounted for 78% of all stocked products. This confirms the strong consumer preference for PET formats over cans or glass. One of my favorite insights was consumer trend analysis. The top brands account for the majority of consumption, and the curve drops sharply afterward. This shows just how concentrated consumer preference is. Finally, hawkers turned out to be the silent giants of distribution, responsible for 47% of total consumption. This project reminded me how much distribution, visibility, and packaging influence market dominance. And it reinforced something powerful: Sometimes the difference between a top performing brand and a struggling one isn’t the product, it’s the execution. I really enjoyed breaking down this dataset and transforming it into insights that brands can act on. If you're into data analytics, Power BI storytelling, or market insights, I’d love to connect! @getnervs @ezekiel_aleke #NervsDataChallenge #DataAnalytics
English
27
2
24
768
Nervs retweetledi
PecsTheAnalyst🫰
PecsTheAnalyst🫰@Official_Asappp·
This morning I'll be submitting the @getnervs data challenge and I must say it's been a while I touched a dataset. It's not what I imagined but this is what I got with the dataset that was provided. #NervsDataChallenge @ezekiel_aleke What do you think?
PecsTheAnalyst🫰 tweet mediaPecsTheAnalyst🫰 tweet media
English
0
2
3
597
Nervs retweetledi
FavHenry
FavHenry@Henry82113798·
Alimosho Soft Drink War in 4 screenshots 🇳🇬 Coca-Cola 84% ND | Pepsi 73% | Local brands own the streets | Chilled = pure distribution game Dashboard built in Power BI for @getnervs #NervsDataChallenge
FavHenry tweet mediaFavHenry tweet mediaFavHenry tweet media
English
1
1
1
219
Nervs retweetledi
Daniel Fatimehin
Daniel Fatimehin@jesus_kid01·
Just analyzed product visibility across 1,500 retail outlets. Coca-Cola leads the market, PET bottles dominate packaging, and shops remain the strongest distribution channel. Data always tells a story. @getnervs #NervsDataChallenge
Daniel Fatimehin tweet mediaDaniel Fatimehin tweet mediaDaniel Fatimehin tweet media
English
0
1
0
180