Yang Guo @[email protected]
5.1K posts

Yang Guo @[email protected]
@hashseed
Googler. Chrome tooling, including @ChromeDevTools. Previously @v8js. 郭扬.
Katılım Nisan 2014
382 Takip Edilen4.2K Takipçiler
Sabitlenmiş Tweet
Yang Guo @[email protected] retweetledi

We just released version 0.5.1 for the @ChromeDevTools #MCP server , and it's a big one for compatibility: we've added *Node.js 20 support*!
We saw that many of you were running into issues with older Node.js versions.
github.com/ChromeDevTools…
English
Yang Guo @[email protected] retweetledi

Yang Guo @[email protected] retweetledi

✨ More Gemini is coming to DevTools! ✨ Try the new experimental AI assistance panel in Chrome Canary 131 and later to get help understanding layouts and debugging your CSS. Learn more at goo.gle/devtools-ai-as…

English

@hashseed @fabiospampinato @43081j @_gsathya @marvinhagemeist @bmeurer Indeed, actually the DevTools would also reset the async call stack depth to 0 but Node.js is not disabling the hooks properly because of...a typo 😂 fix in github.com/nodejs/node/pu…
English

Fun fact: Every Promise that is created is affected by this overhead in Node. Literally every Promise.
Fabio Spampinato@fabiospampinato
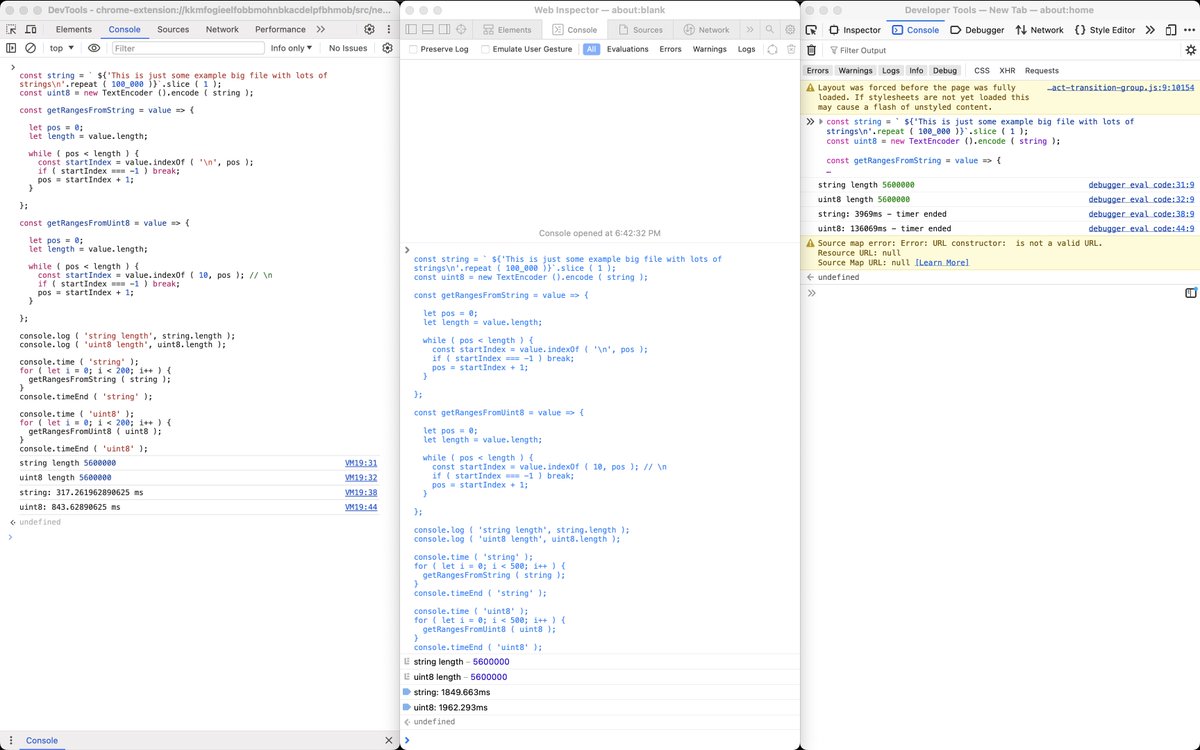
It'd be interesting if there was a flag in @nodejs for disabling async hooks completely, or even better if they were near 0 cost until you actually used them, because in a Promise-heavy profile trace there's this stuff that seems related to async hooks all over the place.
English

@JoyeeCheung @fabiospampinato @43081j @_gsathya @marvinhagemeist @bmeurer I think we disable the Debugger domain when profiling.
English

@fabiospampinato @43081j @_gsathya @marvinhagemeist You could disable it in the DevTools settings. I guess by default it assumes that you are trying to debug and therefore sends Runtime.setAsyncCallStackDepth even when you go straight to the performance panel. Maybe the UI can be tweaked to send it differently? @bmeurer @hashseed

English

@Jack_Franklin drinking some Scottish whiskey right now 🥃
English
Yang Guo @[email protected] retweetledi

DevTools united at @CSSDayConf! It was wonderful to collaborate and discuss web debugging together, cheers to the future of open web 🥂 @nicolaschevobbe @razvancaliman

English

@rauchg I agree with the general sentiment, but in case of the English language... Wasn't it mostly gunboats and redcoats?
English

@cramforce @v8js Thanks for the gesture.
I no longer work on the V8 team, and I think the V8 team deserves that cake :)
English

The 90s were calling and we answered. Lots of electricity being saved here. Thanks to the @v8js team for shipping bytecode support so many months ago. I'm so happy to see it deployed in a serverless environment.
GIF
Vercel@vercel
Vercel Functions can now cache compiled bytecode, reducing cold start latency by up to 27% in larger applications. Try experimental support today and share your feedback. vercel.com/blog/introduci…
English

@cramforce @v8js You are right. The startup snapshot has more constraints.
For snapthsotting next.js after boot Node.js should already have implemented support iirc. Might still be worth it.
English

We *could* use a snapshot. The benefits of bytecode are that it just works without any cooperation of the software (with respect to open files, sockets, etc.). I think realistically, we could only reliably snapshot after next.js (for example) boots but before it loads user code.
Additionally, startup time is extremely sensitive to the size of the function, and snapshots may be at the wrong side of that trade-off. It's definitely something we're interested in, though.
English

@hashseed @erikcorry Whatever it is at the end of the day I think in this particular case we may be talking about the same exact sequence of bytes, so I'd expect pretty much the same performance. Uint8Array probably received less attention I guess.
English

@robpalmer2 @fabiospampinato @addyosmani @ChromeDevTools Wouldn't the allocation sampling profile do the trick?
English

@hashseed @fabiospampinato @addyosmani @ChromeDevTools The idea is to find out accidental sources of short-lived objects that incur high GC perf costs. The fact that they cross a timing boundary is just more signal on the cost side.
English

In @ChromeDevTools you can now find memory issues more easily.
We added new filters to "Memory" to find duplicate strings, objects retained by detached DOM nodes and other reasons when taking heap snapshots.

English

@robpalmer2 @fabiospampinato @addyosmani @ChromeDevTools Trying to allocate objects to get the right GC timing seems like a bad idea though?
English

@fabiospampinato @hashseed @addyosmani @ChromeDevTools I guess you probably care most about the objects (and their creation sites) that survived one full GC but then died soon after.
English

@fabiospampinato @addyosmani @ChromeDevTools Yes, this could be implemented.
Do you have a use case for knowing which objects die?
English

@hashseed @addyosmani @ChromeDevTools But it could be implemented differently, no? Like what's stopping not actually freeing anything when under a particular mode, so that those objects could be inspected, and then actually freeing them when exiting this special mode?
English


