
how now
1.6K posts


@AlexTISYoung clever...sidestepping the notoriously thorny MCHgbQ....
English

An impressive paper giving precise estimates of heritability from whole genome data. However, although framed in terms of missing heritability, they only compare their estimates to 'pedigree' estimates from UKB, not twin or Loic's own recent sib estimates, which are often different.
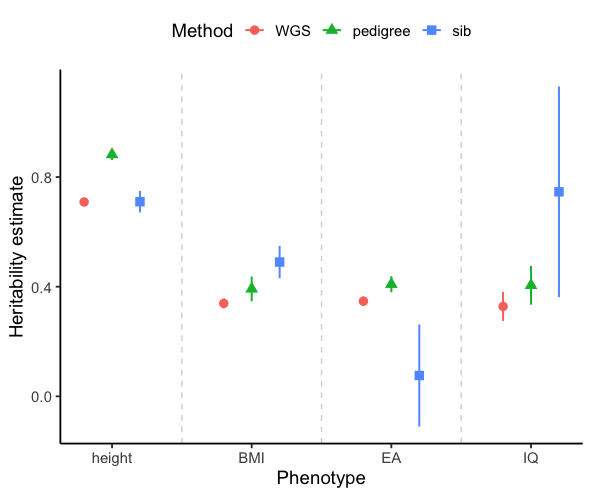
As shown in this plot, the differences between WGS, pedigree, and sib-regression estimates is not consistent at all across phenotypes.
For height, WGS and sib-regression estimates agree — but should they? They are both affected differently by assortative mating, with WGS expected to be higher than sib-regression when there's assortment. However, the pedigree estimate (0.882) is quite a lot higher and a lot of twin estimates (not shown) are also higher than 0.7 (before assortative mating correction).
For BMI, the WGS estimate (0.339) is quite a lot lower than the sib-regression estimate (0.49). Why is this? G x family environment?
For EA, the WGS estimate is 0.347, which isn't so far off pedigree and twin estimates (around 0.4). But then the latest sib-regression estimate puts it at 7.6% (SE 9.5%), even lower than the RDR estimate I produced back in 2018 (17%, SE 9%). Clearly, these WGS, pedigree, and twin estimates for EA are not consistent with the most powerful sib and RDR estimates, which should be more reliable for a socially stratified and environmentally affected phenotype such as this.
Then we get to IQ. Here, the ordering with respect to sib-regression is reversed, with the only sib-regression estimate giving 0.75 (SE 0.20). Although this is noisy, it seems to imply h2 is pretty high, at least 0.35 and perhaps higher than indicated by the pedigree and WGS estimates here. Perhaps that's the low reliability of the UKB fluid intelligence measure, around 0.6. If we inflate the WGS IQ h2 estimate to be on the scale of a more reliable measure (~0.8) gives h2=0.43. This is still much lower than many of the twin estimates, which often put adult intelligence at 0.6-0.8, and considerably below the point estimate from sib-regression (which is also mostly from not very reliable measures).
Overall, the missing heritability is narrowing for many traits by inclusion of rare variants, and measuring the signal from rare variants is the main contribution of these WGS based estimates IMO — they are not reliable ways to estimate overall heritability in a way that will settle any controversies, unlike sib-regression and RDR.
And our estimates from different methods for most of the traits that make this debate interesting (who cares about h2 of mean cell hemoglobin?) still seem inconsistent in ways that are hard to explain.
Loïc Yengo@LoicYengo
We are pleased to announce that our new study explaining the missing heritability of many phenotypes using WGS data from ~347,000 UK Biobank participants has just been published in @Nature. Please check out our manuscript here: nature.com/articles/s4158….
English
@SashaGusevPosts curious what @AlexTISYoung makes of this. is 'overcontrolling' on the table here?
English
@SashaGusevPosts inflation wrt to what tho? tan et al found deflation for iq & no inflation for ea
English

Nice! Whole-genome heritability estimates in the UK Biobank. Average WGS-h2 was 26%, with 21% common and 5% rare. Broadly aligns with recent sib-reg and RDR estimates.
Loïc Yengo@LoicYengo
We are pleased to announce that our new study explaining the missing heritability of many phenotypes using WGS data from ~347,000 UK Biobank participants has just been published in @Nature. Please check out our manuscript here: nature.com/articles/s4158….
English
@SashaGusevPosts >spend years waiting for large sample wgs-greml
>finally arrives
>12 hours pass
>bored of this. i now yearn for large sample within-family wgs-greml.
English
@how_now00 Unexpected, especially given the lower corresponding estimate for IQ. But I think once you see evidence of pop strat you really need within-family estimates to draw strong conclusions about RVs.
English
@SashaGusevPosts yea idk. not sure how to reconcile the two.
what did you make of 43% h2 of ea coming from RVs?
English
@how_now00 Wainschtein et al. don't have within-family estimates to compare to. But the huge drop in h2-WGS after adjusting for geographic clusters is exactly what population stratification would look like (which Tan et al also observed for pop GWAS of EA/IQ).

English
@AnglesonNorman @KirkegaardEmil not 100% sure what i meant with this, but standing by it.
English
@AnglesonNorman @KirkegaardEmil unfair. we produce equal amounts of methane.
English

I think i just discovered an incredible new method of hierarchical (divisive) clustering, and it's stupidly easy to compute.
Step one: comparing each variable, compute the correlation matrix (M1).
Step two: comparing each column of the correlation matrix, compute another correlation matrix (M2).
Step three: comparing each column of M2, compute another correlation matrix (M3).
Step 4: ...
Step Z: Repeat until every cell in the matrix is either 1 or -1.
After step Z, you can look at any particular row, and for that row, the columns scored as 1 will be in one group, and the ones scored as -1 will be in the other group. You've made your first split!
Next, you can divide the groups into two new correlation matrices, and repeat steps 1 through Z, except this time applied towards the correlation matrix of whatever group has more internal diversity. Repeat until satisfied that no division contains coherent subdivisions of its own.
I think this works really, really well.
English
@AnglesonNorman @KirkegaardEmil (skills issue)
which is too bad cause one of the worst things about the substack sphere is that it’s chock full of shitty analyses and a has complete lack of methods posts
English
@how_now00 @KirkegaardEmil I don't know how to write a story about the glories of methodology unless it's a supplement to a normal post.
English
Oh that's a good way of putting it. The task of positing clusters is to declare which populations share 'conceptual similarity', but when you take correlation matrices calculated from correlation matrices, you get a metric of high-level conceptual similarity computed individually for every pair of populations.
English
@AnglesonNorman @KirkegaardEmil yea i just meant the sort of heuristic feel to it. what kinda of data did you do this with? any interesting results?
English
@how_now00 @KirkegaardEmil They're both hierarchical clustering methods but mcquitty's thing is an agglomerative method as opposed to a divisive one.
English

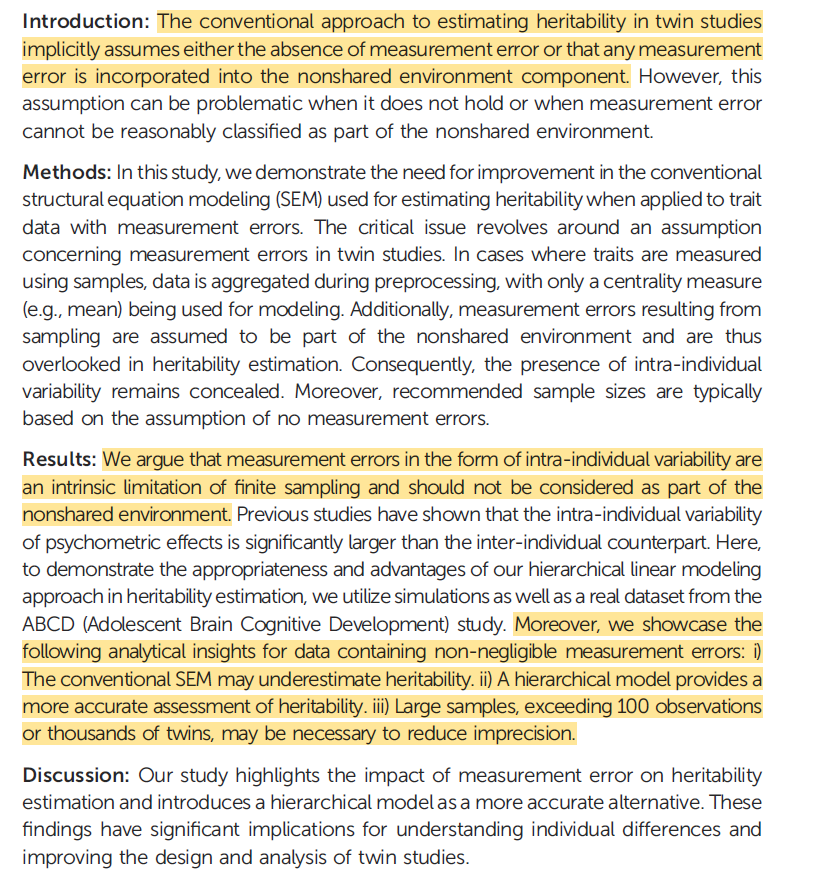
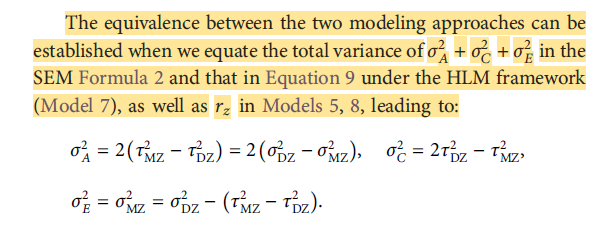
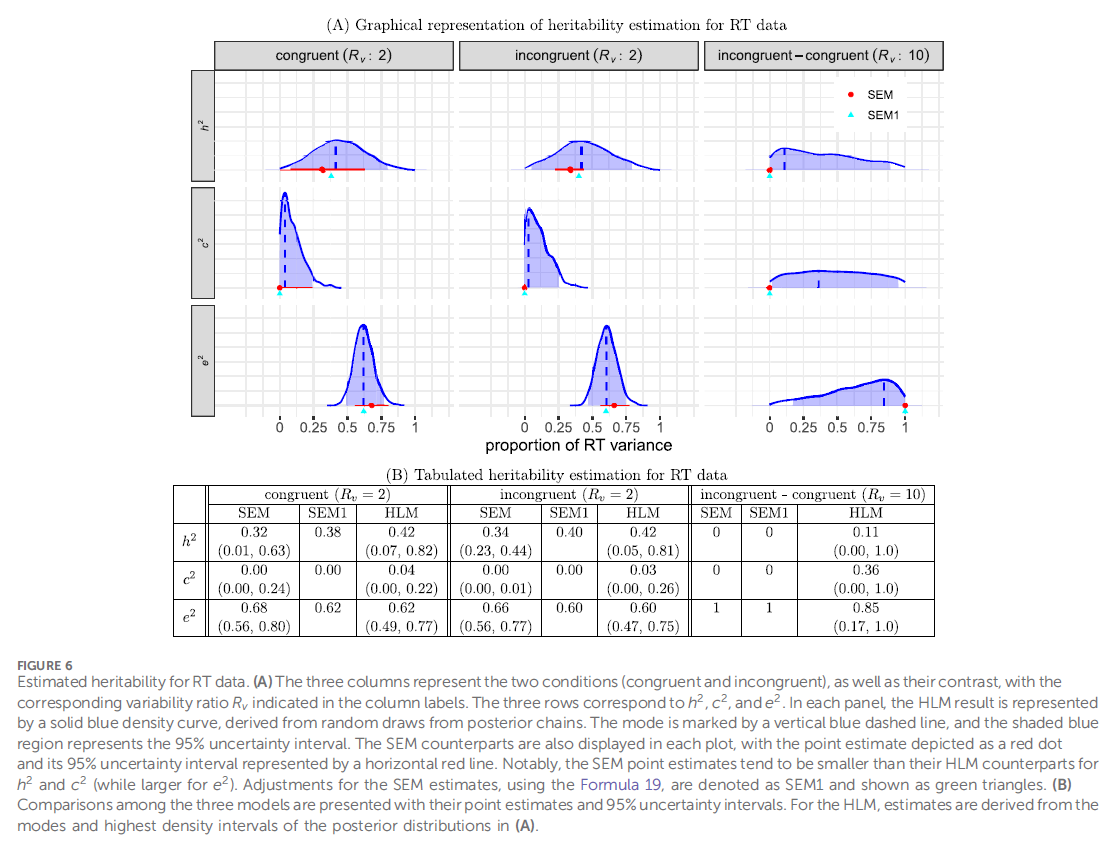
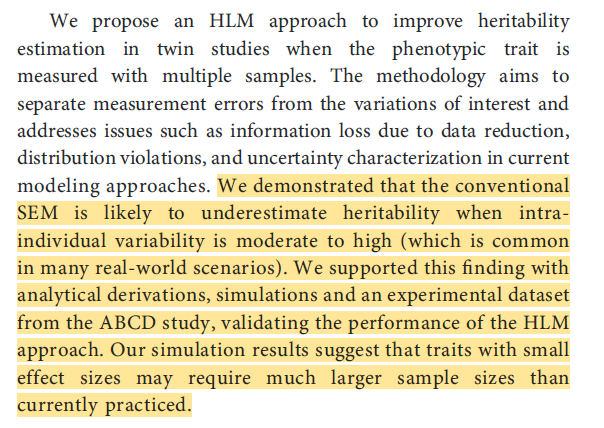
Traditional twin models using SEM can systematically underestimate heritability because violations of measurement invariance and intra-individual variability are lumped into the nonshared environment.
A hierarchical linear modeling (HLM) framework addresses this by explicitly separating true within-individual variance (measurement noise) from between-individual genetic variance. As a result, after properly modeling measurement error, estimated heritability values increase.
English
@AnglesonNorman @KirkegaardEmil reminds me a bit of mcquitty’s ‘elementary linkage analysis’
English
@greegle_mudzone @odoreida most of what I’ve read by him is his popular works and I’ve enjoyed them. would recommend the vital question and life ascending as top two
English

@odoreida @how_now00 if I wanted to get a special someone a book by Nick Lane, are his works for laymen any good? Or are you better off just reading papers?
English
@krichard121212 maybe if a lion could speak, I would it understand it after all
English
