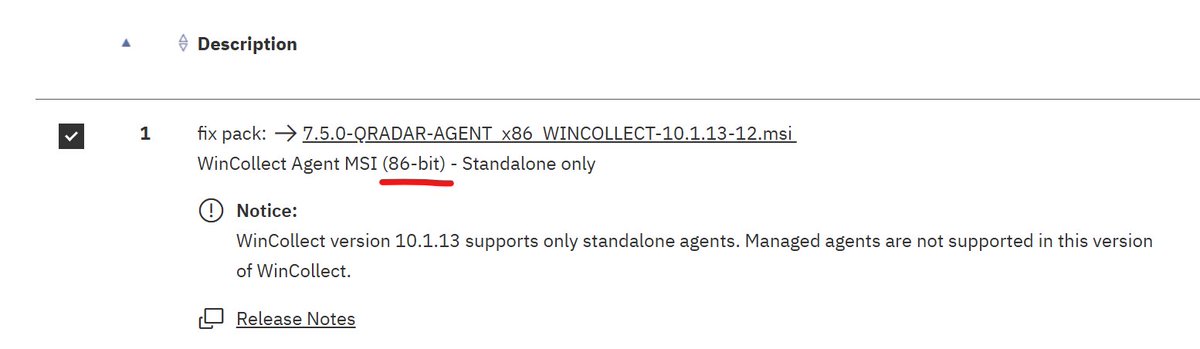
@scott_lowe C’mon, it’s not product name, it’s partnnumber. At every vendor part numbers names are silly.
English
Dmitry Tomko
1.8K posts
@ibmtechie
IBM and Red Hat evangelist. Cloud Engineer and Architect. All opinions are my own and do not necessarily reflect those of my employer (IBA Group).


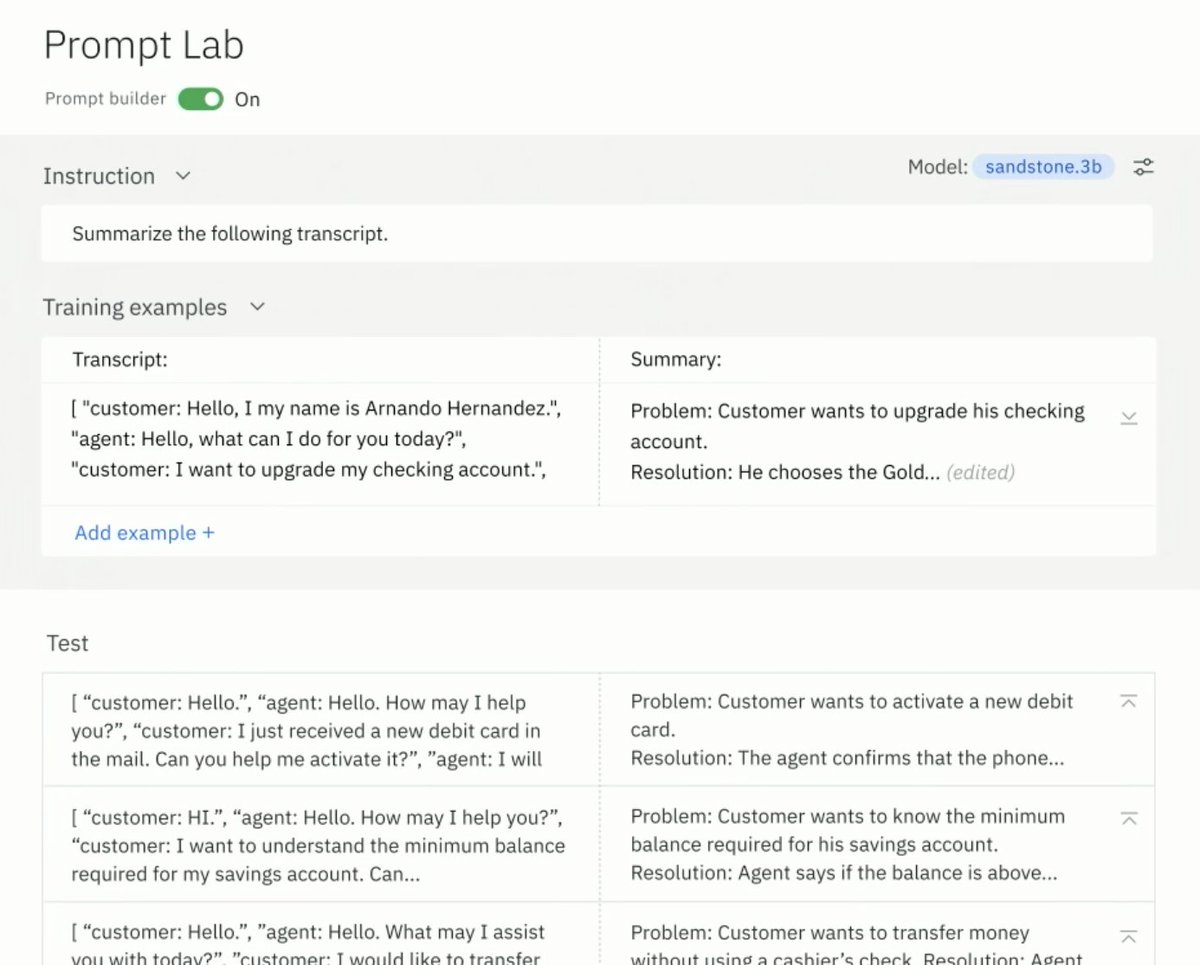
We've partnered with IBM to bring the new Granite 3.0 language models to Replicate. These models are trained on license-permissible data collected following IBM’s AI Ethics principles for trustworthy enterprise usage. Best of all, they're fully open-source and Apache 2.0 licensed. Details below 🧵
Palo Alto Networks is buying @IBM’s QRadar cloud software assets and moving customers over to its own platform. IBM will adopt @PaloAltoNtwks products internally and train over 1,000 consultants on them. Palo Alto Networks is buying security assets from IBM to expand customer base. A @jordannovet story from @CNBC cnb.cx/4bF9Uzf cc @furrier @dvellante #IBMThink #Think #Think24 @DivesTech @cloudpundit @rwang0 @BillMew