Built a free Chrome extension for momentum traders.
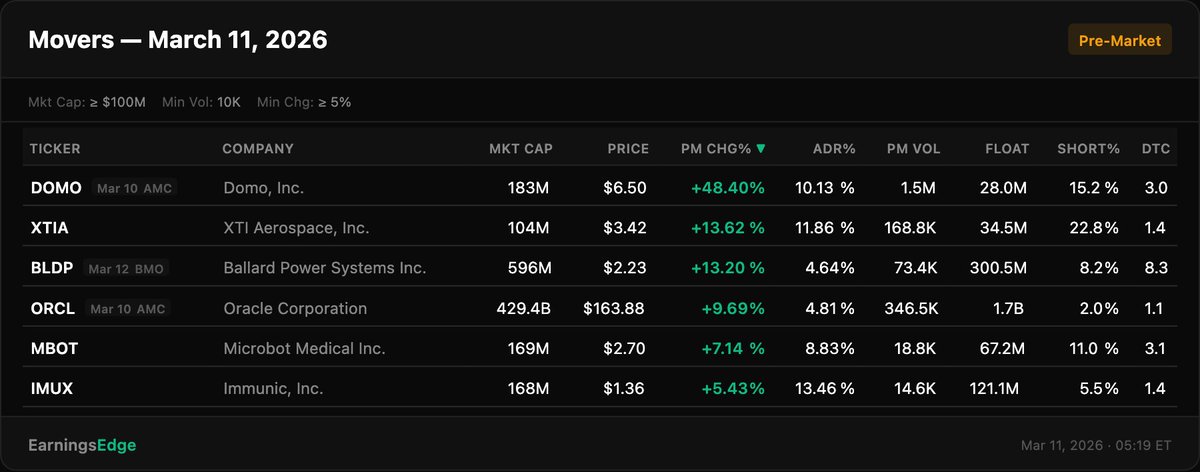
Earnings calendar, movers scanner, Themes, Industry Relative Strength, one dashboard.
earningsedgedev.github.io/earningsedge/
My Top 5 Free APIs and Libraries for Stock Screening & Trading Dashboards
Many people have been asking about the specific APIs and libraries I use to build my stock screening tools and trading dashboards. After extensive testing, I’ve narrowed it down to a few reliable tools. Here is a breakdown of my current tech stack based on my personal experience.
1. TradingView Screener (Unofficial Library)
For my Pre-market Gappers scan, I rely on a TradingView screener library. While this isn't an official API, it provides scanning results and criteria identical to the TradingView desktop software.
GitHub: github.com/shner-elmo/Tra…
Pros: Highly accurate; matches TradingView’s powerful UI filters.
Cons: There is a 15-minute data delay. Unless you require sub-second real-time scanning, this is usually negligible for swing trading or early-day prep.
2. Finviz Finance Library
I primarily use this to scrape news and market sentiment. It’s excellent for aggregating headlines and URLs directly from Finviz.
GitHub: github.com/lit26/finvizfi…
Use Case: Automatically fetching the latest news for specific tickers to understand the "catalyst" behind a price move.
3. TradingView Lightweight Charts & Tradingview Widgets
This is my go-to for technical analysis visualization.
GitHub: github.com/tradingview/li…
Chart Widgets: tradingview.com/widget-docs/wi…
The Difference:
Lightweight Charts: Best for building custom tools. It’s high-performance and allows you to program any custom indicator you can imagine.
Chart Widget: If you want a "plug-and-play" experience, this is easier but comes with a 15-minute delay and limits you to native indicators (no custom Pine Script/logic integration).
4. Brokerage APIs: Charles Schwab vs. IBKR
I have integrated both, and here is how they compare:
Charles Schwab API: Completely free. The only "catch" is that you need to manually refresh your tokens weekly.
IBKR API: While the API is free, real-time data usually costs $1–$2/month. It also requires you to have TWS (Trader Workstation) or IB Gateway running in the background.
My Verdict: I prefer Schwab for daily use. It’s more "lightweight" as long as you remember to update your tokens over the weekend.
5. Apache ECharts
ECharts is the "all-rounder" of data visualization. I use it to complement TradingView’s charts.
Official Website: echarts.apache.org
Use Case: While TradingView is more professional for price action, ECharts is superior for Post-Trade Analysis in my trading journal. The interactivity and ability to visualize complex equity curves or win-rate distributions are top-tier.
------
Of course, there are plenty of superior paid resources out there. However, if you’re a trader just getting started with vibe coding, these free tools are perfect for getting your hands dirty and sharpening your skills first.
Feel free to share more in the comments!
När det blir allt lägre trösklar att bygga egna verktyg så kan det vara värt att påminna om att Börsdata PRO+ erbjuder ett REST-API med global data för privat bruk.
599 kr / månad
449 kr / månad (Nordnet PB/AT)
259 kr / månad (Avanza PRO/PB)
I’m excited to announce that I’ve teamed up with @IntlSpeculator to build one of the most comprehensive historical US stock market databases ever attempted.
We’re collecting daily equity data from all major US stock exchanges back to 1815, well before the CRSP era.
Most existing datasets before 1926 are weekly or monthly (often without full OHLC). Daily data prior to the mid-20th century is extremely sparse. Our goal is to reconstruct that missing history as rigorously as possible, and to do so with full OHLC candles where possible.
We'll be working with professors at leading US universities to ensure our methodology meets a high standard of academic scrutiny and historical accuracy.
We’ve already catalogued 1815–1829, with OHLC reconstruction becoming possible from ~1828 onward (earlier years rely primarily on bid/ask quotations).
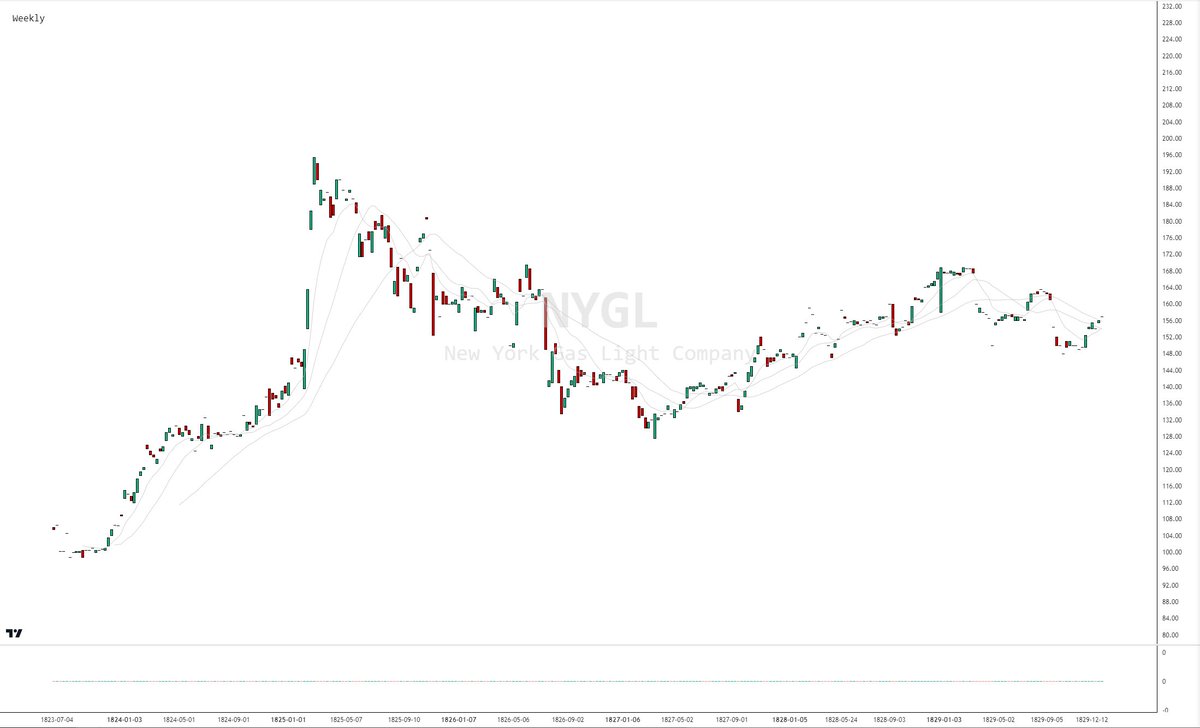
Below is a weekly chart of the New York Gas Light Company from its IPO. NYGL has the distinction of being the longest continuously listed stock on the exchange. Today it's known as Consolidated Edison $ED. It was the first gas company to list on the exchanges and was immediately one of the most popular issues traded at the time of its listing in 1824.
As the database develops, I’ll be sharing charts, anomalies, and insights from early US markets here.
For deeper historical dives, I write more on my Substack:
@barrybivingston1" target="_blank" rel="nofollow noopener">substack.com/@barrybivingst…