Sal Goodarzi
3.3K posts

Sal Goodarzi
@macrotides
Principal Quantitative Researcher | PhD Computational Science | Creator of the MacroTides model | Macro | Bitcoin | Gold


The Macro X-Ray: Stripping the Noise From the S&P 🧵 To understand the true health of global capital, and where it is headed next, we must strip away the distorting veil of fiat currency. The chart below visualizes a five-year rolling Z-score of the S&P 500 to Gold ratio. Statistically, a rolling Z-score measures how many standard deviations a data point sits away from its historical moving average. When this indicator hits the upper green bands, equities are unsustainably expensive relative to hard money and historical norms. When it plunges into the deep red troughs, as it has done only a handful of times in modern history, it signals a severe structural distortion.


🧵Gold or Bitcoin: Which Is a Better Piggy Bank? I don't care which one should replace the other, or become the global settlement layer (neither probably will but that's for another thread). But we should be able to answer a simple question: If an average person wants to store spare wealth and outrun inflation, which asset is better, and why? Not just in terms of return size, but also: How long do you need to hold? How badly does timing matter? What are your oddds of beating inflation? Here's a fair comparison.

JUST IN: US national debt rises above $39 trillion ($39,000,000,000,000)

The Macro X-Ray: Stripping the Noise From the S&P 🧵 To understand the true health of global capital, and where it is headed next, we must strip away the distorting veil of fiat currency. The chart below visualizes a five-year rolling Z-score of the S&P 500 to Gold ratio. Statistically, a rolling Z-score measures how many standard deviations a data point sits away from its historical moving average. When this indicator hits the upper green bands, equities are unsustainably expensive relative to hard money and historical norms. When it plunges into the deep red troughs, as it has done only a handful of times in modern history, it signals a severe structural distortion.

The Macro X-Ray: Stripping the Noise From the S&P 🧵 To understand the true health of global capital, and where it is headed next, we must strip away the distorting veil of fiat currency. The chart below visualizes a five-year rolling Z-score of the S&P 500 to Gold ratio. Statistically, a rolling Z-score measures how many standard deviations a data point sits away from its historical moving average. When this indicator hits the upper green bands, equities are unsustainably expensive relative to hard money and historical norms. When it plunges into the deep red troughs, as it has done only a handful of times in modern history, it signals a severe structural distortion.


🧵Gold or Bitcoin: Which Is a Better Piggy Bank? I don't care which one should replace the other, or become the global settlement layer (neither probably will but that's for another thread). But we should be able to answer a simple question: If an average person wants to store spare wealth and outrun inflation, which asset is better, and why? Not just in terms of return size, but also: How long do you need to hold? How badly does timing matter? What are your oddds of beating inflation? Here's a fair comparison.

Who’s been selling into BTC ETF buys? Since BTC first broke its previous ATH in Mar 2024, Whales (=addresses with >1k BTC) have been selling ~900k BTC. ETFs have been buying ~550k BTC. Net = -350k BTC! That’s supply overhang which is often overlooked when $1M per BTC targets are casually thrown around. Perhaps for the first time in history, institutions are late to the game and are being the exit liquidity.

ARTHUR HAYES: Bitcoin is going to $3.4 million by 2028.


You keep hearing on @CNBC that the Fed's goal is to get inflation to come down. 🤔 That's NOT their main goal. Inflation goes up and then comes back down always. That's the easy part. Their MAIN goal is to make sure it doesn't go back UP AGAIN to equal or higher YoY highs 🤯


Rates: first time this has happened since 2023. The orange line is Russell. The red/green spread is the near-term SOFR futures curve, indicating how much of a cut/hike markets are expecting over the next 3-6 months. After the recent hot inflation print, the spread has pushed back above zero, for the first time since 2023. Only around 8 bps of hike is being priced in, but the direction is what matters. The last time 8 bps of hike was priced in, for the first time, Russell went on to sweep the highs, then went into the 2022 bear market. Could a similar scenario be playing out right now? The new Fed chair is an AI believer whose views are: inflation is ultimately the Fed’s fault, QE made the Fed too large and too involved, and the balance sheet became a toy rather than a crisis tool. He says: he wants to stop bailing out the rich (I’m paraphrasing of course), shrink the Fed’s market footprint first, drain excess liquidity further, rebuild credibility, and then cut policy rates only if inflation allows. Lots of big talk. 
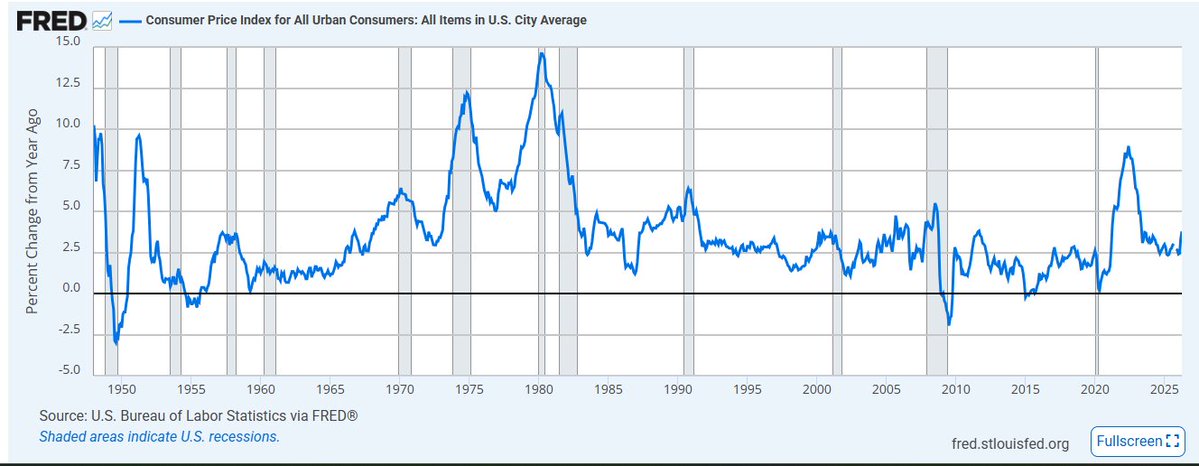
How long can K.Warsh keep rates low on the back of the AI “productivity boom" story, especially since inflation seems to be re-accelerating? Or, is inflation “transitory” (but this time for real)? Let me know your thoughts in the comments.


