
₿ shijauddin
788 posts
₿ shijauddin
@marathibitcoin
बिटकॉइन हे एक आभासी चलन आहे, ज्याला क्रिप्टोकरन्सी म्हणून ओळखले जाते.
Latur, Maharashtra, India Katılım Nisan 2010
225 Takip Edilen27 Takipçiler

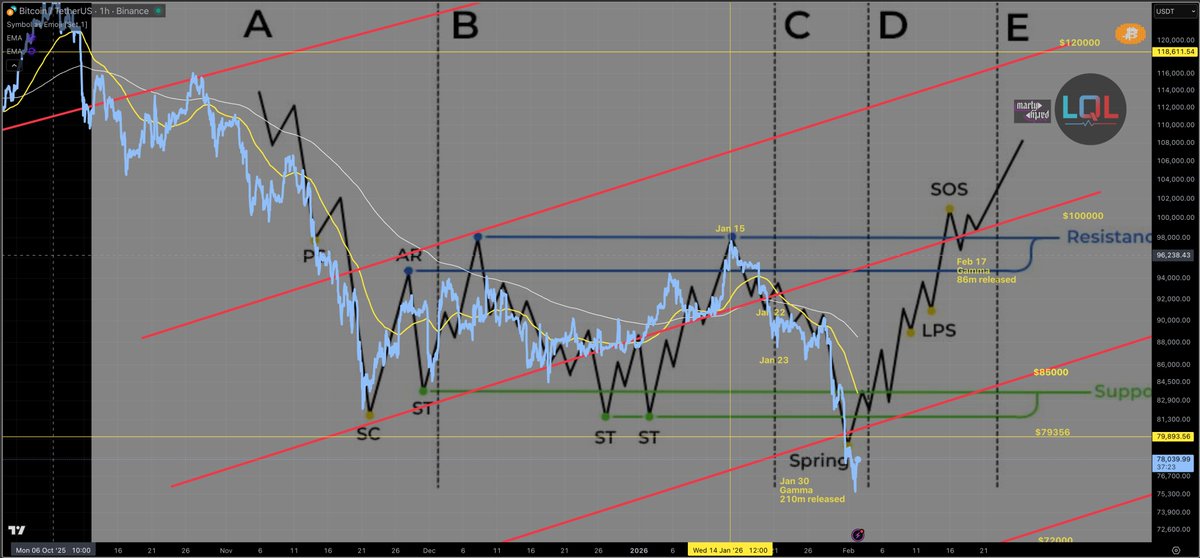
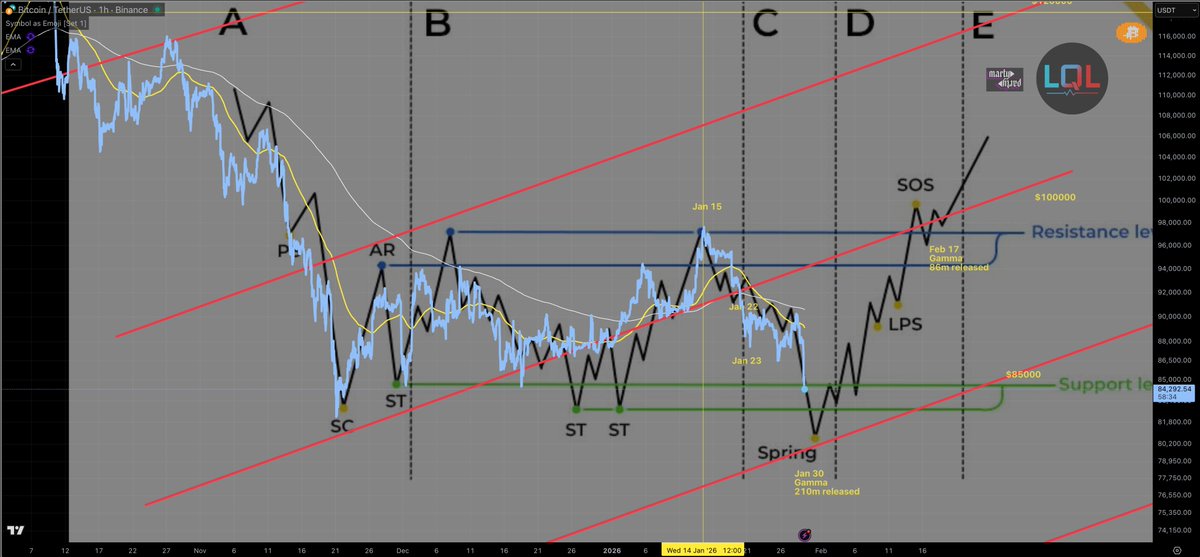
Any non believers of the LQL strategy pay attention.
Price swings to the 50% MMA (green line) and then violently to Short Max Pain (purple line) - too easy.

English
₿ shijauddin retweetledi
₿ shijauddin retweetledi

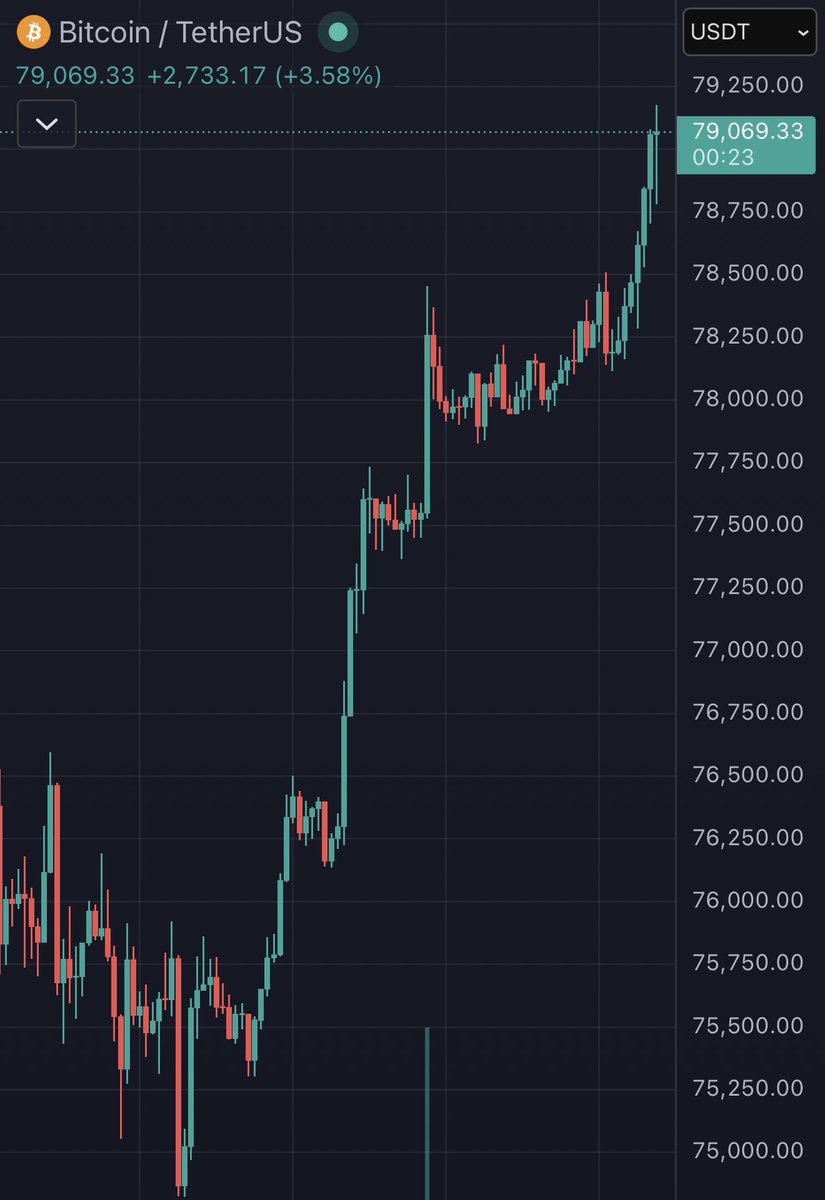
🚨 BITCOIN IS BEING MANIPULATED, AND I HAVE PROOF
Everyone is talking about how Bitcoin went up $5,000 in 15 minutes.
Everyone’s sharing charts…
But almost nobody is explaining what actually caused it.
Stop staring at the chart. Look at the flows.
Within minutes, wallets tied to BlackRock, Robinhood, Binance, Coinbase, and Wintermute all became active simultaneously.
Large stacks moving between exchanges.
Huge market buys hitting thin order books.
Then suddenly...
They flipped and started selling everything.
Here’s what really happened:
– Liquidity was thin
– Leverage was stacked heavily on one side
– Funding rates were already stretched
So price gets pushed higher aggressively.
Why?
To trigger FOMO and, more importantly, force shorts out while pulling new longs into the market.
Once enough leverage was trapped…
They started unloading.
The data shows it clearly:
– Coordinated inflows to major exchanges
– Large market buys clustered within a narrow window
– Immediate reversal after stop levels were cleared
– Heavy selling right after liquidation zones were hit
This is how market makers dump without crashing price.
They move the market toward liquidity, trigger liquidations, and then sell directly into the chaos they just created.
And it wouldn’t surprise me if they were running long and short positions simultaneously through separate wallets.
If you’re new to this market, understand one thing:
Bitcoin almost never moves like this because of headlines.
It moves when leverage builds up and someone with enough size decides it’s time to wipe everyone out.
Watch funding rates. Watch open interest. Watch where coins are moving, not who is posting charts.
For the record, I was the only one publicly calling the exact bottom at $16,000 three years ago and the top at $126,000 in October.
If you missed those calls, don’t worry. I’ll call the next one too.
Turn notifications on. If you’re not following yet, you’ll understand why that was a mistake later.

English
₿ shijauddin retweetledi
₿ shijauddin retweetledi

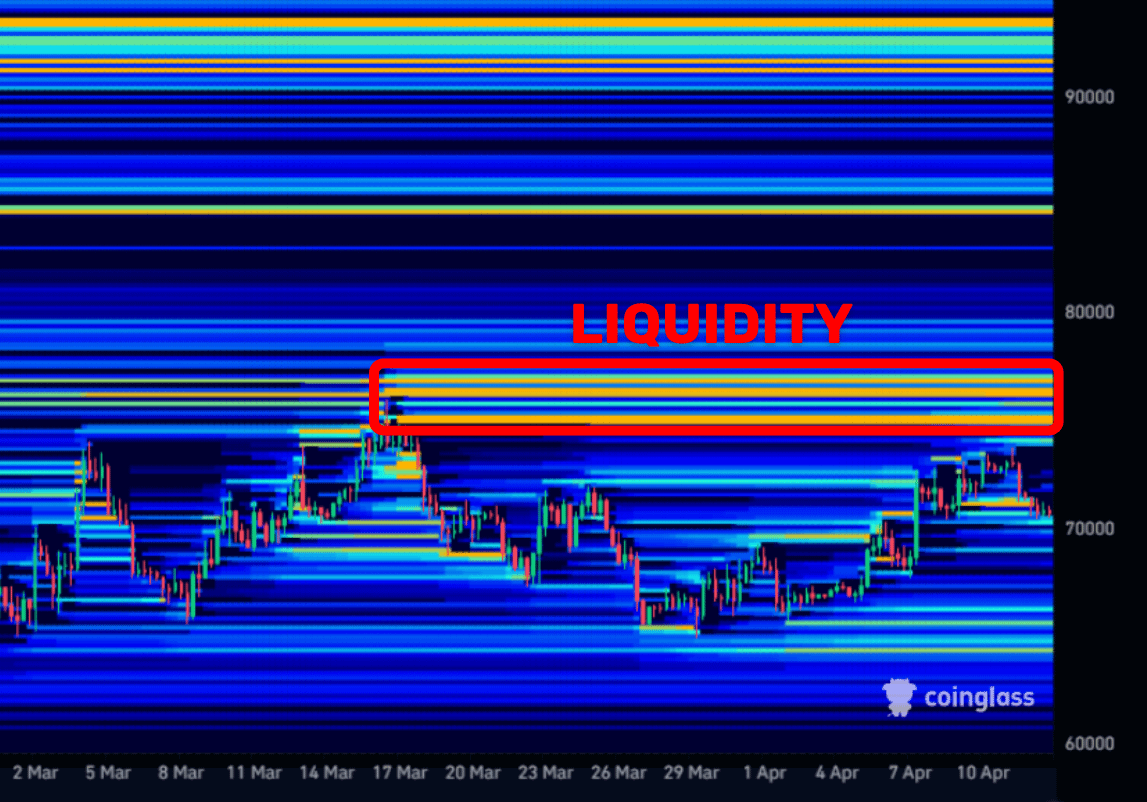
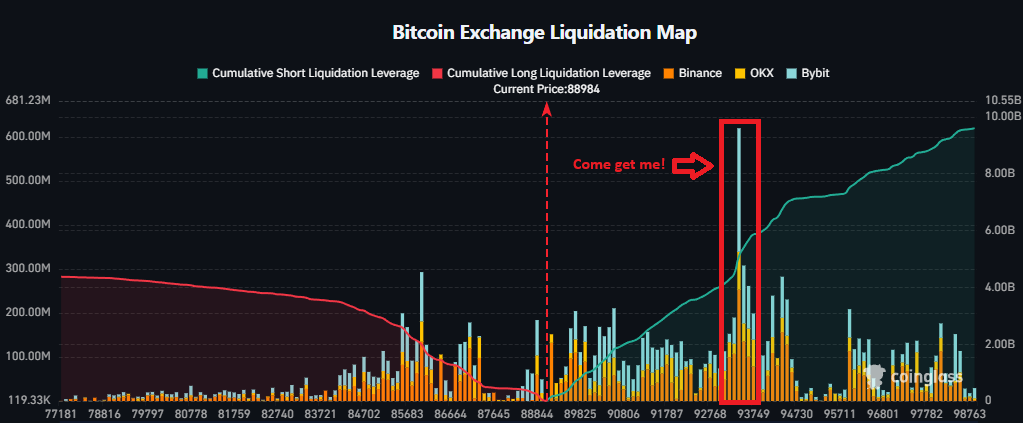
PAY ATTENTION:
$BTC has stacked MASSIVE liquidity above $75,000.
Funding is negative, which means too many shorts.
You know what happens next.
English
₿ shijauddin retweetledi

₿ shijauddin retweetledi
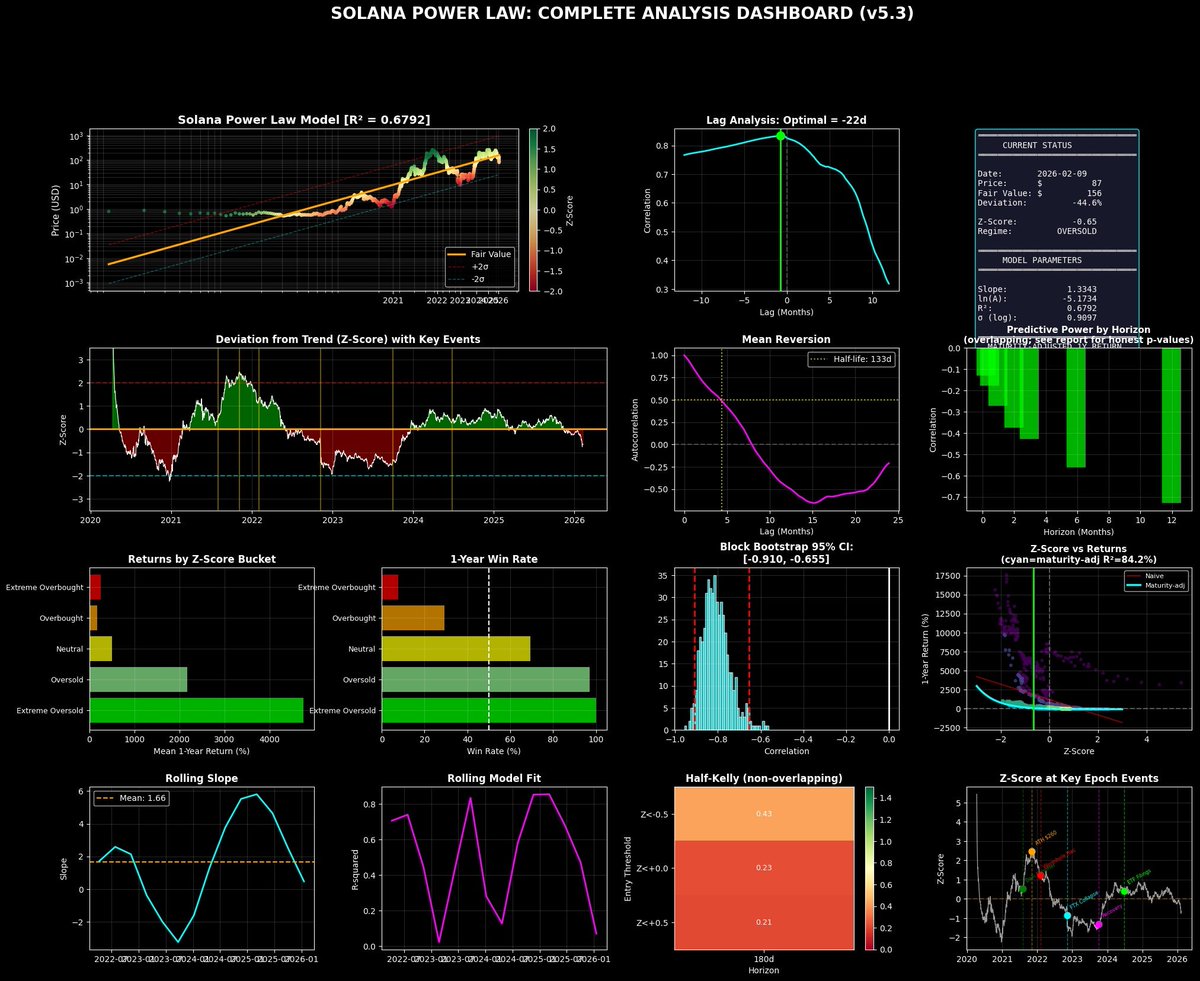
Solana Valuation - Feb 9 update by @david_eng_mba
* Spot price: $87
* Power-law fair value: $156
* Gap: -$70
* Discount to fair value: -44.6%
* Z-score: -0.65 (oversold)
Model fit (R²) and robustness
* Power-law fit: R² = 0.6792
* Interpretation: the long-run trend explains about 68% of in-sample log-price variation (descriptive fit).
* Residual autocorrelation: AR(1) = 0.997
* Interpretation: residuals are highly persistent, so naive OLS significance is unreliable.
* Parameter stability:
* Rolling slope range: -3.245 to 5.807
* Rolling R² range: 0.022 to 0.854
* Interpretation: fit is regime-sensitive, not fully stable through time.
* Predictive correlation robustness (1-year horizon):
* Overlapping correlation: r = -0.7277, R² = 0.5296 (descriptive only; overlapping windows inflate effective sample).
* Block bootstrap (90-day blocks): mean r ≈ -0.807, 95% CI [-0.9096, -0.6548]
* Interpretation: direction (oversold tends to outperform) is robust in dependent-data resampling.
Forecast and forecast robustness
* Mean-reversion half-life: 133 days
* Drift/snap-back path (model-implied):
* ~133 days: ~$135
* ~266 days: ~$166
* 1-year forecast (naive Z-only): +1819%
* Not robust for forward use (dominated by early-era outliers and dependence effects).
* 1-year forecast (maturity-adjusted, preferred):
* Expected return: +51%
* 68% PI: -29% to +219%
* 95% PI: -66% to +574%
* R² (maturity-adjusted): 0.8415 vs 0.5296 for Z-only (in-sample improvement +31.2 percentage points).
* Key constraint on confidence:
* Independent long-horizon sample is very small (about 4 non-overlapping 365d periods), so magnitude precision is low even when directional signal looks strong.
Bottom line
* Valuation: materially below trend (-44.6%).
* Outlook: positive skew with high uncertainty.
* Robustness: directional mean-reversion signal is reasonably robust; point forecast magnitude is not highly robust.
@solana
English
₿ shijauddin retweetledi

₿ shijauddin retweetledi


₿ shijauddin retweetledi
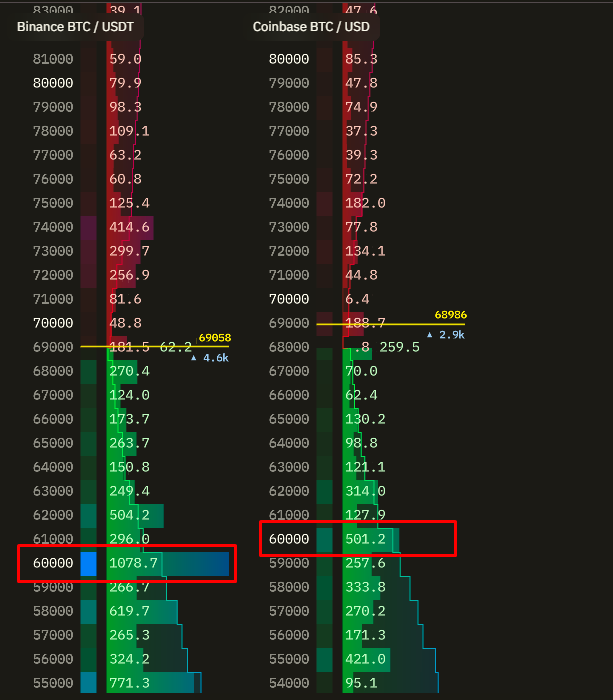
The question isnt where is the dollar price going, the question is how is it being manipulated and why is the manipulation not being regulated.
Who benefits from this unregulated manipulation?
#MarketStructure #DrainBinance

English
₿ shijauddin retweetledi


₿ shijauddin retweetledi

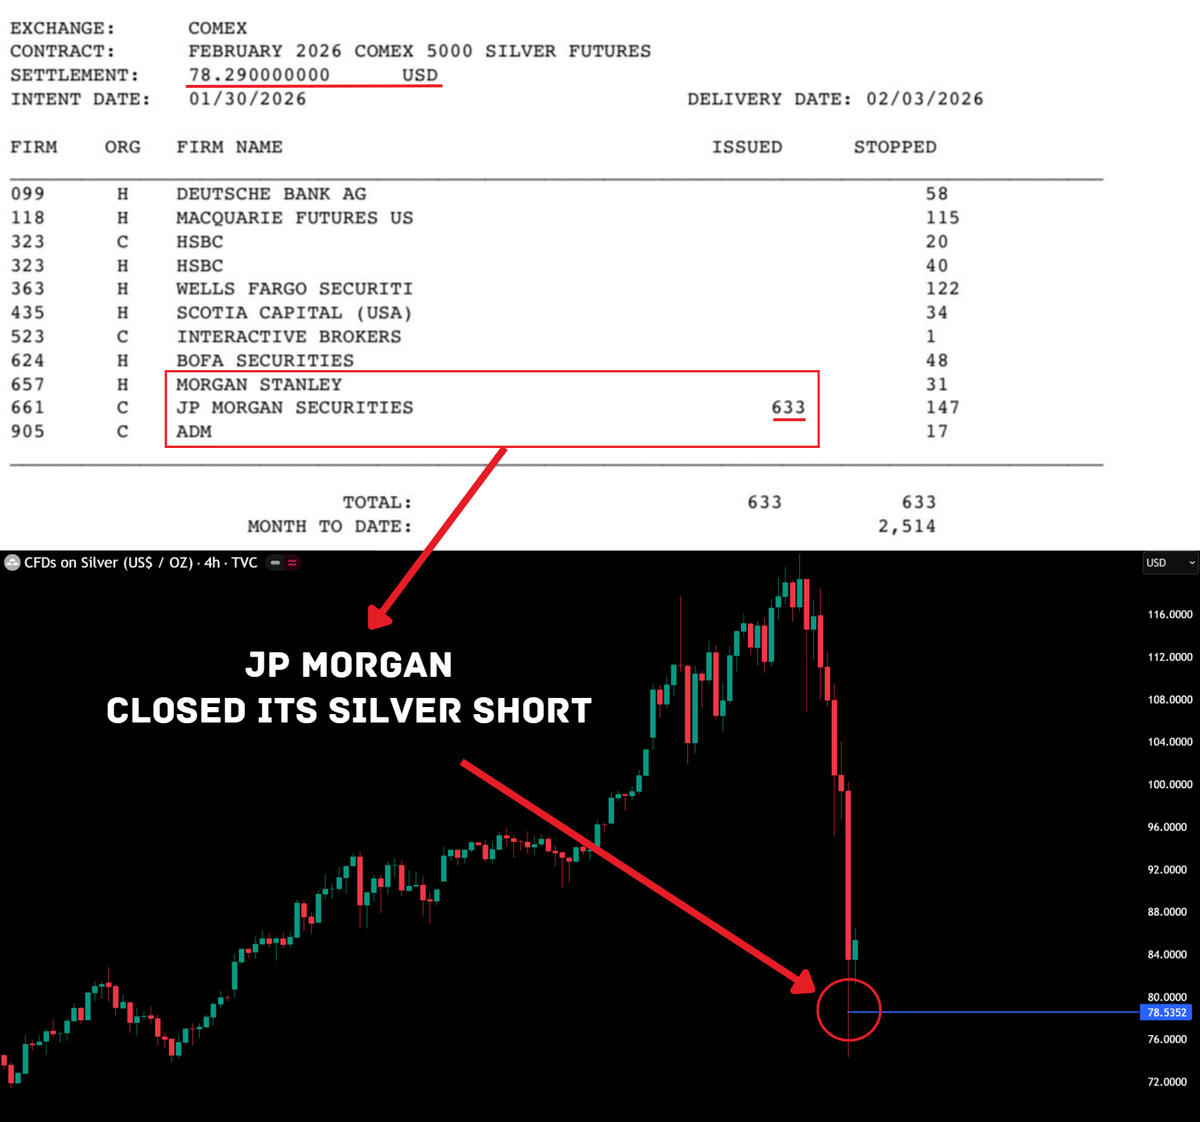
🚨 SILVER DUMP WAS DONE BY JPMORGAN, AND I'VE GOT PROOF.
A COMEX report says JPMorgan closed its silver short around ~$78.
Silver went from ~$121 to ~$74, then settled around ~$78.
That's the EXACT level.
That timing isn't random.
Now connect the dots.
On Dec 2, 2025, the US banks had 17,838 silver futures short.
That's ~89.19M oz.
At ~$121, that's ~$10.8B in short notional.
That one fact explains a lot.
This is the same play you see in crypto.
- They push price to pull leverage in.
- Then they dump it into thin liquidity.
- Stops get clipped.
- Longs get liquidated.
- Then the cover happens into the panic.
THIS IS NOT GOOD AT ALL.
And now trust is breaking.
People don't know where to park money anymore.
- DOLLAR IS DUMPING
- GOLD IS DUMPING
- STOCKS ARE DUMPING
- CRYPTO IS DUMPING
- BONDS ARE PUMPING
Watch the flows.
I've studied macro for 10 years and I called almost every major market top, including the October BTC ATH.
Follow and turn notifications on.
I'll post the warning BEFORE it hits the headlines.
English
₿ shijauddin retweetledi
₿ shijauddin retweetledi

₿ shijauddin retweetledi

Why Bitcoin Explodes at Settlement and Not Adoption (Paper vs Spot)
Given this structure, a 5 to 10X Bitcoin settlement squeeze is not just possible, it’s the likely outcome.
Most people think Bitcoin rallies on adoption.
That’s wrong.
Bitcoin reprices when claims are forced to settle.
Paper vs Spot: The Core Mistake
There are two Bitcoins trading under the same ticker:
Spot Bitcoin bearer asset, on chain, final settlement, capped at 21M.
Paper Bitcoin exchange balances, ETFs, derivatives, lending claims.
Same ticker. Different physics.
Price is not set by total supply.
Price is set by marginal tradable supply.
Paper Bitcoin expands that supply without creating coins.
The Setup (Hard Numbers)
Reduce the system to one representative venue:
Real reserves: 100 BTC
Customer claims: 130 BTC
Paper multiple: 1.3×
Spot price: $100,000
The exchange is economically short 30 BTC.
Not fraud.
A balance-sheet bet that users won’t all withdraw at once.
The Game Theory (Coordination Game)
Every depositor faces the same choice:
Trust (leave funds) or
Verify (withdraw).
1. Everyone Trusts (Status Quo)
Depositor Result: App shows “1 BTC”
Market Result: Suppressed. (Supply appears inflated: 130 claims vs 100 coins)
2. You Withdraw, Others Don’t
Depositor Result: You get real BTC.
Market Result: No Impact.
3. Everyone Withdraws (The Snap)
Depositor Result: Claims > Coins.
Market: Forced spot buying the missing coins must be bought immediately
The equilibrium is “everyone trusts.”
It works until it doesn’t.
You’re not betting on adoption.
You’re betting on Option 3.
How the Unwind Actually Plays Out
Step 1: Early Withdrawals
Withdrawals: 20 BTC
Reserves: 80 BTC
Remaining claims: 110 BTC
System holds. Confidence remains.
Step 2: Coordination Shift
Fear replaces yield.
Additional withdrawal demand: 81 BTC
Available reserves: 80 BTC
Shortfall: 1 BTC
That’s the break.
Step 3: Forced Settlement (This is where price jumps)
The exchange cannot delay settlement.
They must buy spot BTC immediately.
But the sell side is thin.
Illustrative order book:
0.1 BTC @ $100k
0.1 BTC @ $105k
0.3 BTC @ $120k
0.5 BTC @ $150k
To source 1 BTC, the buyer must clear the book up to $150,000. A 50% price move caused by a 1% reserve gap.
Why This Move is Non-Linear
The exchange is a price-insensitive buyer.
They are not optimizing execution.
They are avoiding insolvency.
That’s why:
Small shortages
Create large gaps
Not smooth rallies
This is not a demand story. It’s a settlement constraint.
The Rubber Band Effect
Paper supply behaves like a stretched rubber band.
Expansion phase: Paper multiple rises to Liquidity looks abundant to Price looks capped.
Resolution phase: Claims converge to coins to Effective supply contracts instantly.
Price doesn’t adjust gradually.
It snaps.
The Math (Foundation)
You are not betting on adoption curves.
You are betting on this identity:
130 claims cannot clear against 100 coins without repricing.
No narrative required.
No timing required.
Bottom Line
Bitcoin doesn’t explode when demand appears.
It explodes when settlement is demanded.
The music is still playing.
The system is already short chairs.
That’s the game.
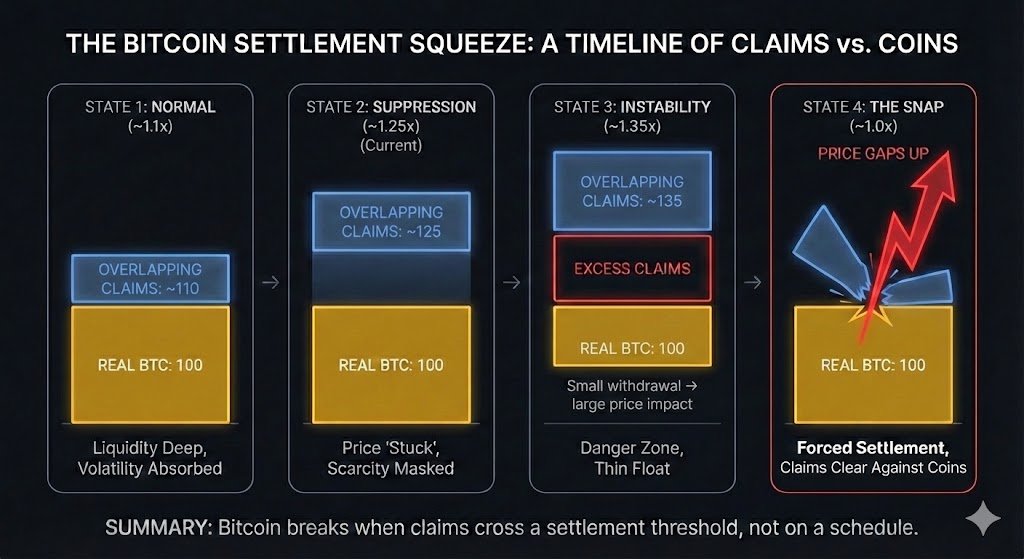
The Trillion Dollar Question, When Does it Break?
Bitcoin doesn’t break on a schedule.
It breaks when claims cross a settlement threshold.
What moves the system from stability to failure isn’t price.
It’s claims rising while float shrinks.
State 2 can last months.
State 3 rarely lasts long.
State 4 happens in days.
Nothing happens.
Then everything happens.
Given my background in energy development, derivatives, and commodity trading and hedging, the clearest analogue is a freeze:
Prices don’t rise gradually, they jump 5–10× when delivery breaks.
English
₿ shijauddin retweetledi

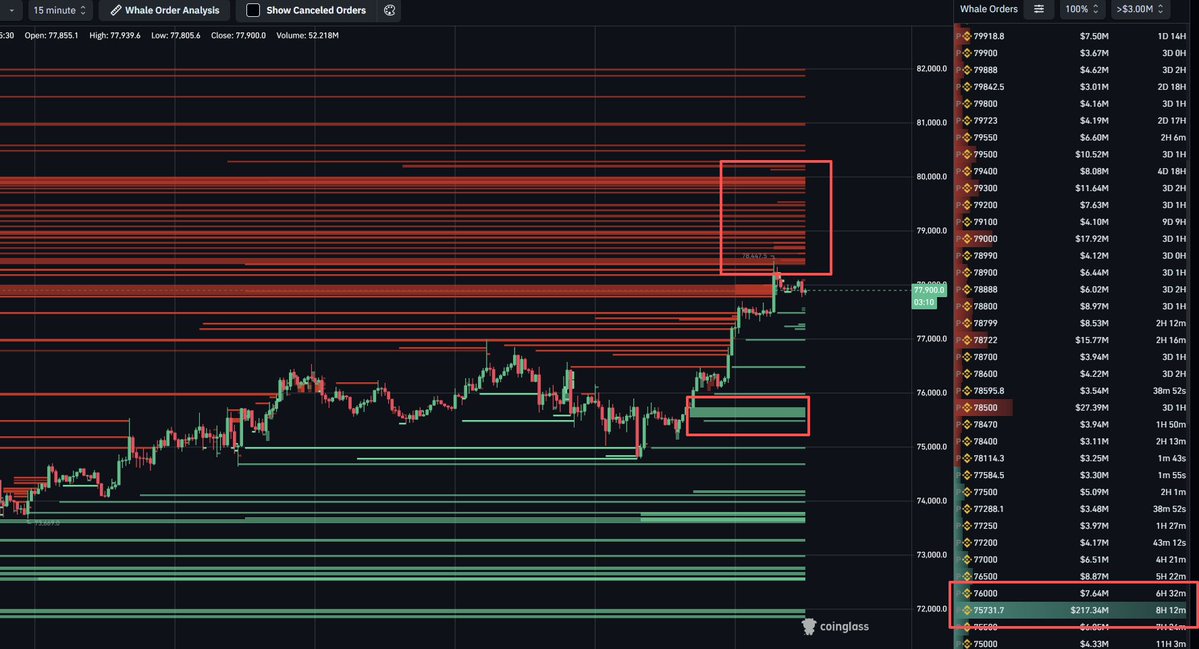
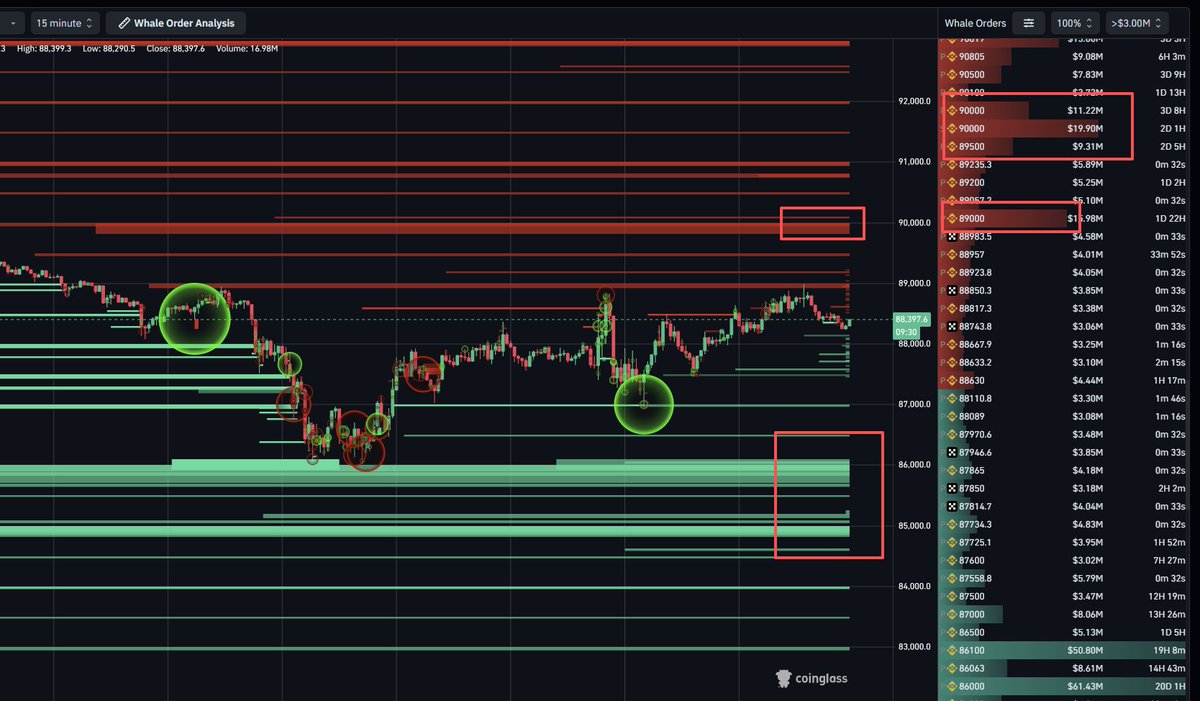
#Bitcoin Whale Orders & Large Trades
Whale buy orders are clearly defending 86k–87k,
while heavy sell liquidity sits above 89k.
Price is respecting whale levels perfectly.
This is a liquidity-driven range, not a breakout.
coinglass.com/large-orderboo…
English
₿ shijauddin retweetledi

🇮🇳 Bitcoin’s Price History on Republic Day
2012 - $6
2013 - $17
2014 - $815
2015 - $275
2016 - $392
2017 - $915
2018 - $11,093
2019 - $3,556
2020 - $8,590
2021 - $32,505
2022 - $36,829
2023 - $23,010
2024 - $41,818
2025 - $102,573
2026 - $87,740
Return over the last 10 years: 22,285%
English
₿ shijauddin retweetledi
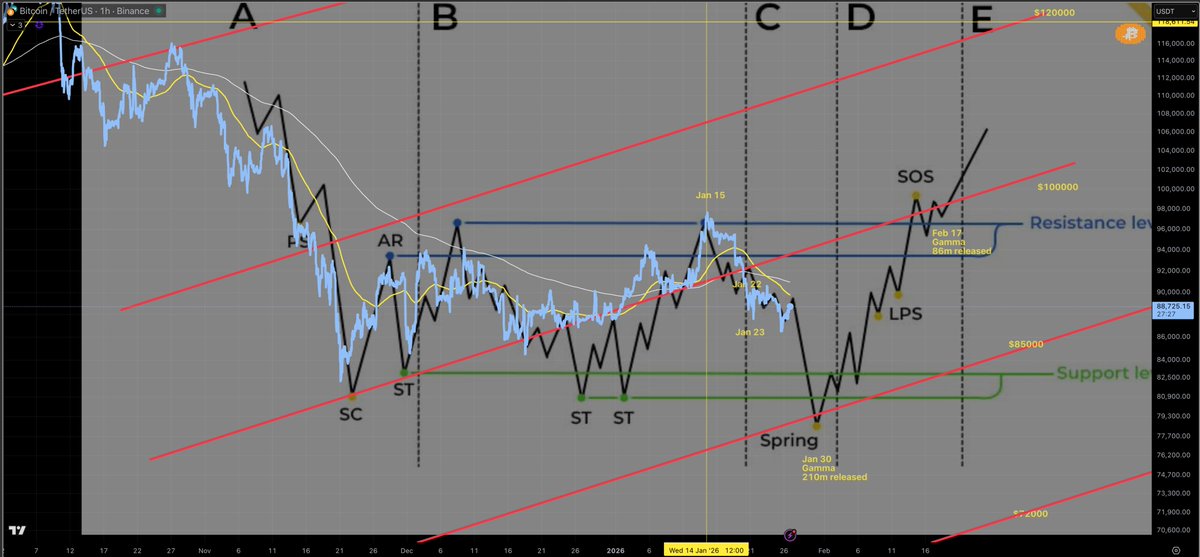
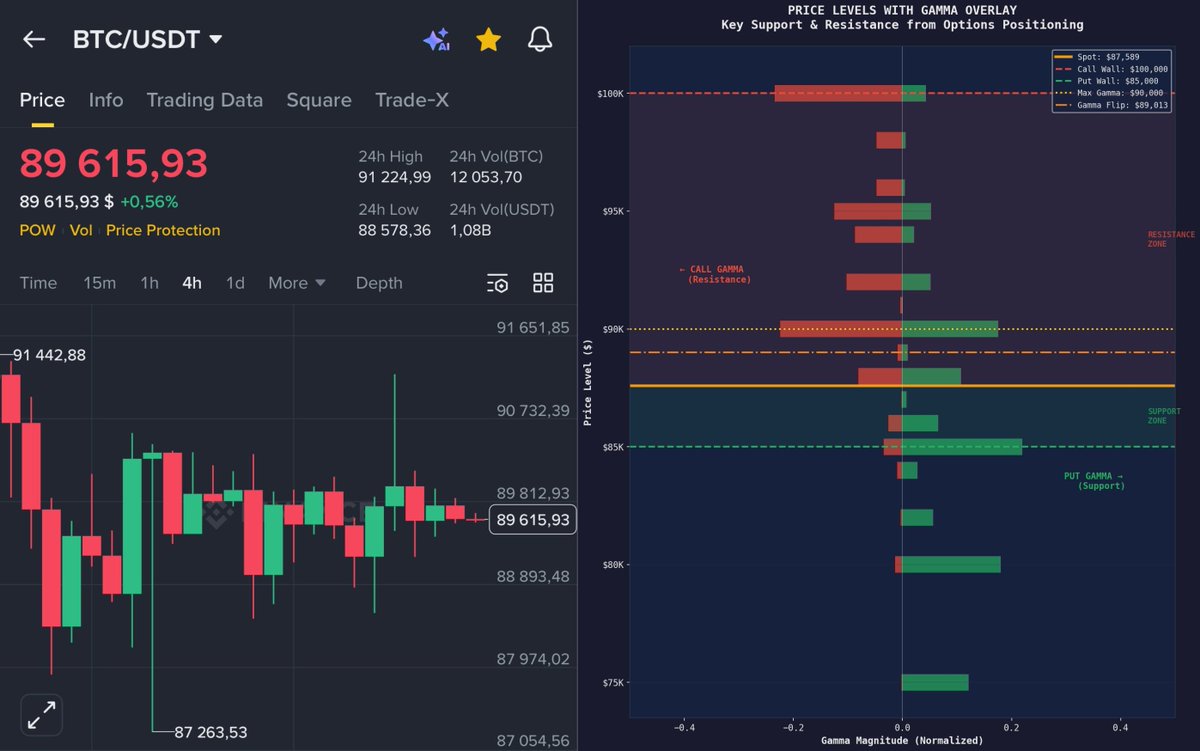
🚨 HERE'S THE REAL REASON BITCOIN IS TRAPPED IN ONE RANGE
If you are wondering why $BTC keeps trading around $85K to $90K no matter how many people try to push it
I have the answer for you.
And it likely resolves in under a week, into the January 30 options expiry.
Here is what is actually going on
Bitcoin is sitting right on a critical options flip level around $88K
ABOVE THAT LEVEL
Market makers are forced to sell into green candles and buy the dip. Any rally gets capped and price gets pulled back to the middle.
BELOW THAT LEVEL
The behavior changes completely. Selling pressure feeds on itself, and volatility grows instead of getting absorbed.
That is why price keeps snapping back to the same area over and over again. It is not because of traders.
Now look at why $90K keeps rejecting.
There's a massive concentration of call options at $90,000. Dealers are short those calls.
Every time price pushes toward that level, they hedge by selling spot BTC.
So what looks like “sell pressure” is really forced supply showing up exactly where traders expect momentum.
That's why every $90K attempt fails.
On the downside, $85K is doing the opposite.
There's heavy put positioning there. As price drops, dealers hedge by buying spot.
That's why every dip gets bought fast.
This creates a tight range that feels completely normal on the surface, but it is not stable at all.
The reason this matters now is timing.
A big chunk of option exposure expires on January 30, 2026, the last Friday of the month.
Once we get past January 30, that pinning pressure will be gone.
Not because people suddenly change their minds, but because the forces holding price in place are gone.
I’ve studied macro for 10 years and I called almost every major market top, including the October BTC ATH.
Follow and turn notifications on.
I’ll post the warning BEFORE it hits the headlines.
English