Mat Boks

2.8K posts

Mat Boks banner
Mat Boks

Mat Boks

@matboksarc

founder @spyincgame also founder of @voltonchain and @the_ape_society on a gamefi architect arc

Base Katılım Eylül 2021
629 Takip Edilen4.5K Takipçiler
Mat Boks retweetledi
Parker
Parker@TheOtherParker_·
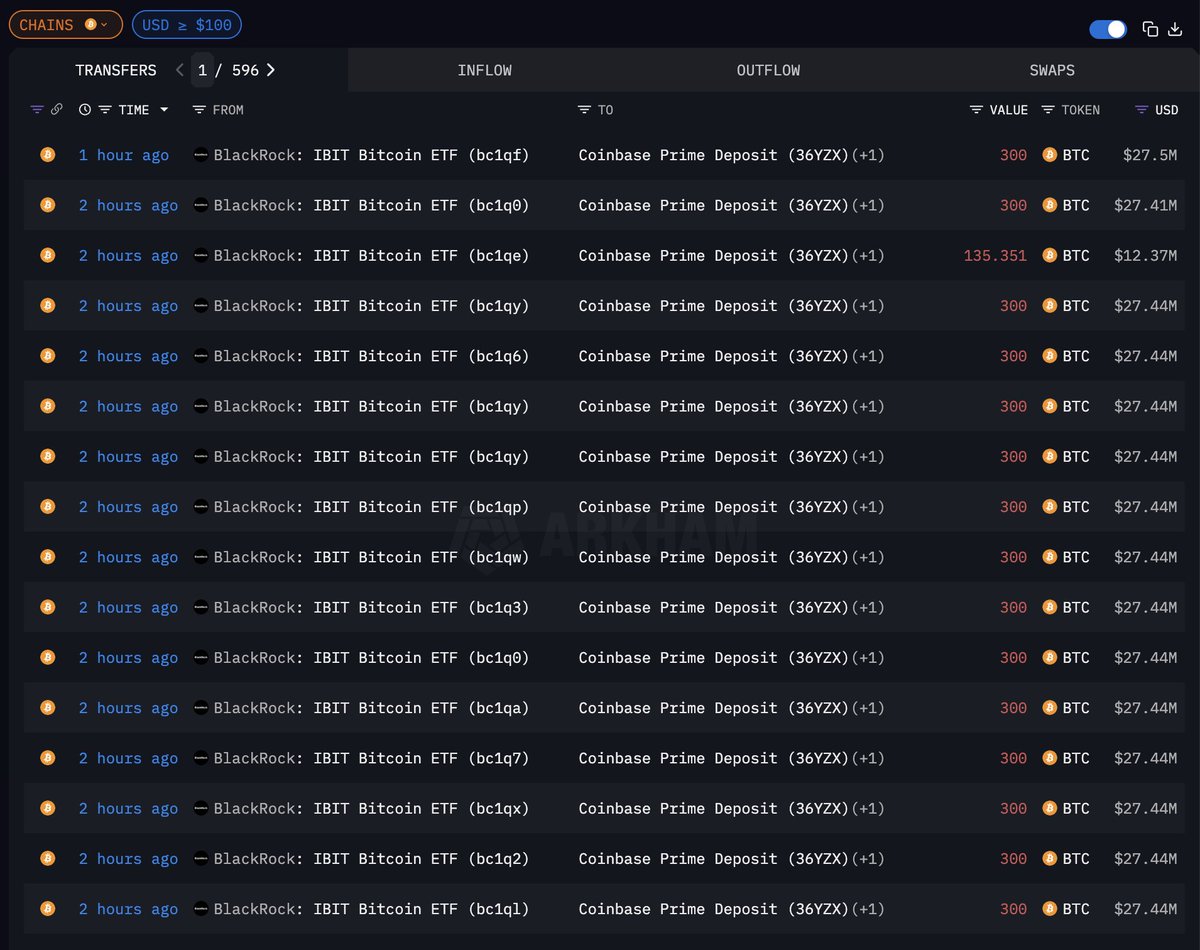
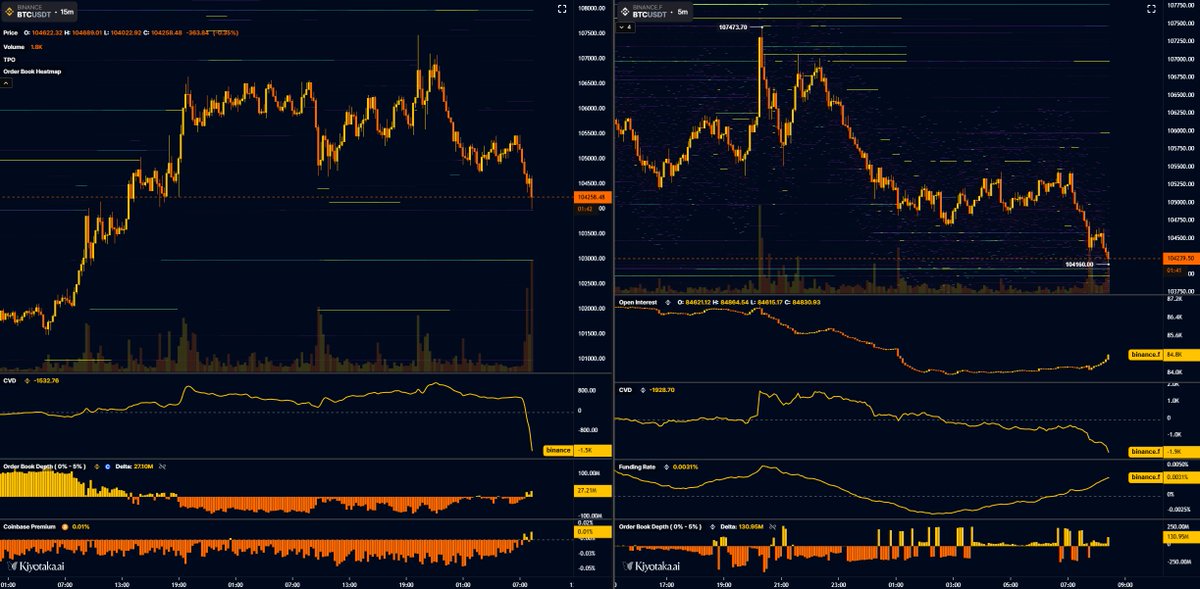
This was the highest volume day on $IBIT, ever, by a factor of nearly 2x, trading $10.7B today. Additionally, roughly $900M in options premiums were traded today, also the highest ever for IBIT. Given these facts and the way $BTC and $SOL traded down in lockstep today (normally SOL trades with beta) + the relatively lower liquidations on CeFi exchanges, this leads me to believe that the nexus of the problem lies with a large IBIT holder. IBIT has become the #1 venue for BTC options trading, so my guess is that a hedge fund trading IBIT options is the culprit. 
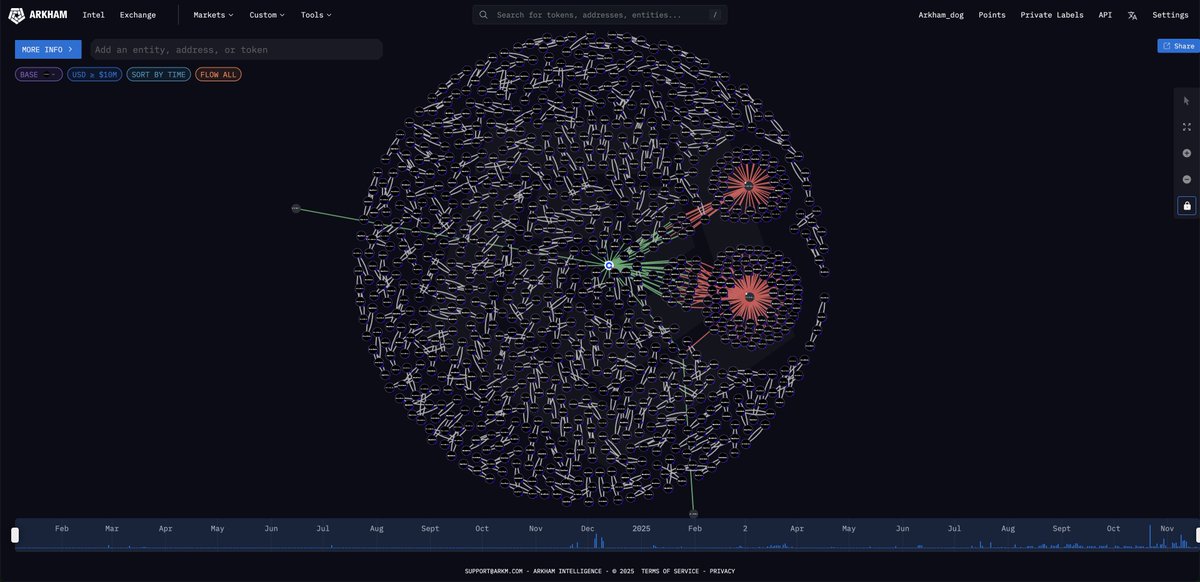
If you look at the 13F filings for IBIT (I like whalewisdom dot com), you'll find a number of interesting names that have the majority of their fund in IBIT. In fact, there are a few in there (not naming names) that have 100% of their fund in IBIT, which likely means no cross margin. In fact, the biggest reason to set up a fund to hold a single asset would be to isolate margin, so that if the trade blew up, the brokers wouldn't have claim to any other assets. Interestingly, most of these giant, single asset funds are based in HK. We know that Asian traders, particularly in China, have been deeply involved in the Silver and Gold trade. Silver was down 20% today, which was the 2nd largest 1 day move in a very long time (largest on Jan 30). We also know that the JPY carry trade has been unwinding at an increasingly rapid pace. This leads me to think that the culprit for the IBIT blowup today was 1 or more HK-based non-crypto hedge funds. As @FranklinBi pointed out, the fund(s) being non-crypto would explain why no one sniffed them out. They would likely have few/no crypto counterparties, meaning complete isolation from CT. The last small piece of evidence I have is that I personally know a number of HK-based hedge funds that are holders of $DFDV, which had the worst single down day ever, with a meaningful mNAV decline. The mNAV had been holding steady surprisingly well throughout this pull back until today. One of these fund(s) could have been connected to the IBIT culprit, as I highly doubt a fund taking that large of a position in IBIT and using a single entity structure would only have the one fund. Now, I could easily see how the fund(s) could have been running a levered options trade on IBIT (think way OTM calls = ultra high gamma) with borrowed capital in JPY. Oct 10th could very well have blown a hole in their balance sheet, that they tried to win back by adding leverage waiting for the "obvious" rebound. As that led to increased losses, coupled with increased funding costs in JPY, I could see how the fund(s) would have gotten more desperate and hopped on the Silver trade. When that blew up, things got dire and this last push in BTC finished them off. I have no hard evidence here, just some hunches and bread crumbs, but it does seem very plausible. Let's see if some more concrete evidence floats to the surface here soon. The smoking gun will be a large fund fitting this profile filing a 13F showing a giant IBIT holding going to zero. Unfortunately, if a fund had their IBIT position liquidated today, they wouldn't have to disclose the position change until 45 days after the quarter end, so we'd be looking at mid May for the smoking gun from 13F filings most likely. Hopefully some of you out there with too much time on your hands this weekend can snoop around more. My guess is that word will start to get out, because something of this size is just too hard to hide. Additionally, if the broker was not able to liquidate the fund in time, the broker may have a hole in their balance sheet, which would be even more difficult to hide.
English
311
661
5K
2.2M
Mat Boks
Mat Boks@matboksarc·
what if 2026 bottom is in for $btc
English
1
0
7
234
Mat Boks
Mat Boks@matboksarc·
@DJbit0 Never left, just back to socials 😬
English
0
0
1
29
Mat Boks
Mat Boks@matboksarc·
Happy new year to everyone that showed up this year and is still around 2025 was pretty tough, but in 2026 I'll keep doing the same thing - building. We already have something lined up, a globaly game changer product love you all
English
4
2
9
176
Pawn ♟️
Pawn ♟️@PawnOfCharts·
@matboksarc Love and miss you Mat, hope you’re all good fam🫶🏻
English
1
0
1
30
Mat Boks
Mat Boks@matboksarc·
@KillaXBT Usually there’s a premarket pump
English
1
0
1
892
Killa
Killa@KillaXBT·
$BTC NY open in 5 minutes. Will we repeat the same pattern? 30m after NY open will decide the direction. Lets see.
Killa tweet media
English
35
27
316
28.6K
Mat Boks
Mat Boks@matboksarc·
what the hell is a prediction market
English
0
0
2
66
The Kobeissi Letter
The Kobeissi Letter@KobeissiLetter·
US Core CPI Inflation: 1. August 2025: 3.1%, 6-month high 2. September 2025: 3.0%, "rare exception release" during government shutdown 3. October 2025: Inflation report is cancelled 4. November 2025: 2.6%, lowest since 2021 What just happened?
English
389
241
2.5K
341.8K
Mat Boks retweetledi
*Walter Bloomberg
*Walter Bloomberg@DeItaone·
*ATKINS: INNOVATION EXEMPTION FOR CRYPTO FIRMS COMING JANUARY
English
45
62
604
147.6K
Arkham
Arkham@arkham·
bad news guys BLACKROCK JUST SOLD MORE $BTC THAN EVER BEFORE They dumped $523M BTC, the highest daily outflow IBIT has ever seen.
Arkham tweet mediaArkham tweet media
English
570
518
4K
562.1K
Mat Boks
Mat Boks@matboksarc·
@52kskew Binance spot vol delta is wild rn
English
0
0
1
450
Skew Δ
Skew Δ@52kskew·
$BTC Some size sold into $104K price area & renewed short interest Pivotal price point here
Skew Δ tweet media
English
21
18
231
23.4K
Mat Boks
Mat Boks@matboksarc·
@Jesseeckel btc increase/decrease never was and will be proportional to m2 increase/decrease. dont try to fit m2 chart into btc, just analyse potential bottoms and tops. been doing a pretty amazing job at that whole year
English
2
0
1
772
Jesse Eckel
Jesse Eckel@Jesseeckel·
Everyone seems to be perplexed that BTC suddenly stopped following M2. The reason this chart is broken is because liquidity that never actually reaches the markets can't bid up price. It's a market plumbing issue. BTC responds to who HAS the liquidity, not just how MUCH exists in aggregate. You'll notice the correlation broke at almost the exact moment the RRP was run down. That was the moment we saw the TGA start sucking market tradable liquidity out of the system. Although global M2 still went higher the liquidity layer that actually touches the market trended lower due to the rebuild. On top of this crypto as a whole and especially altcoins responds more to YOY liquidity MOMENTUM not just global M2 heading higher. AKA how fast is liquidity rising or falling. I've highlighted this before but every single altseason and major bull run lines up perfectly with YOY liquidity momentum exploding higher. This is why alts have felt dead and not comparable to past cycles. There hasn't been enough momentum in liquidity for it to spill over into alts. That and BTC has been driven primarily by a really strong narrative coupled with ETF flows which basically for the first time allowed access into boomer retail money. The M2 BTC chart should start to correlate again once we see market tradable liquidity start to move higher as well. I believe our next major burst in YOY liquidity is due for 2026. This will be crypto's first 5 year cycle.
Jesse Eckel tweet mediaJesse Eckel tweet media
English
98
192
1.5K
176.1K
Whale Insider
Whale Insider@WhaleInsider·
JUST IN: Blackrock deposits 2,042.8 $BTC ($213.49 million) and 22,681 $ETH ($79.83 million) into Coinbase.
Whale Insider tweet media
English
192
118
891
106.4K
Christopher Inks
Christopher Inks@TXWestCapital·
Very highly unlikely. Elliott Wave theory is based on socionomic mood, not merely numbers. So the context of the move should align with the expected context of the mood. In this case, the underlying market regime (decade-long adoption trend, miner economics, and global institutional participation) doesn’t fit a flat’s deflationary narrative anymore in your count. And we haven’t even talked about how such a large wave B, as you are suggesting, overextends the expected 105-130% extension of wave A by pushing up to ~180-200%. Remember, EWT guidelines are descriptive, not predictive, of macro-adoption curves. In other words, you’re overfitting Fibonacci to price extremes.
English
1
0
4
1.5K
Mat Boks
Mat Boks@matboksarc·
uponly from here
English
1
0
3
111
Mat Boks
Mat Boks@matboksarc·
bvol pumping and 77d m2 bottom btc below 105k, eth 3700 and sol 176 will come back to this post in exactly 46 days
English
2
0
3
158
zerohedge
zerohedge@zerohedge·
something is soaking up a LOT of liquidity. In other news, global M2 just went absolutely vertical... and btc fair price is 250K
zerohedge tweet media
English
605
1.4K
11.6K
2.3M