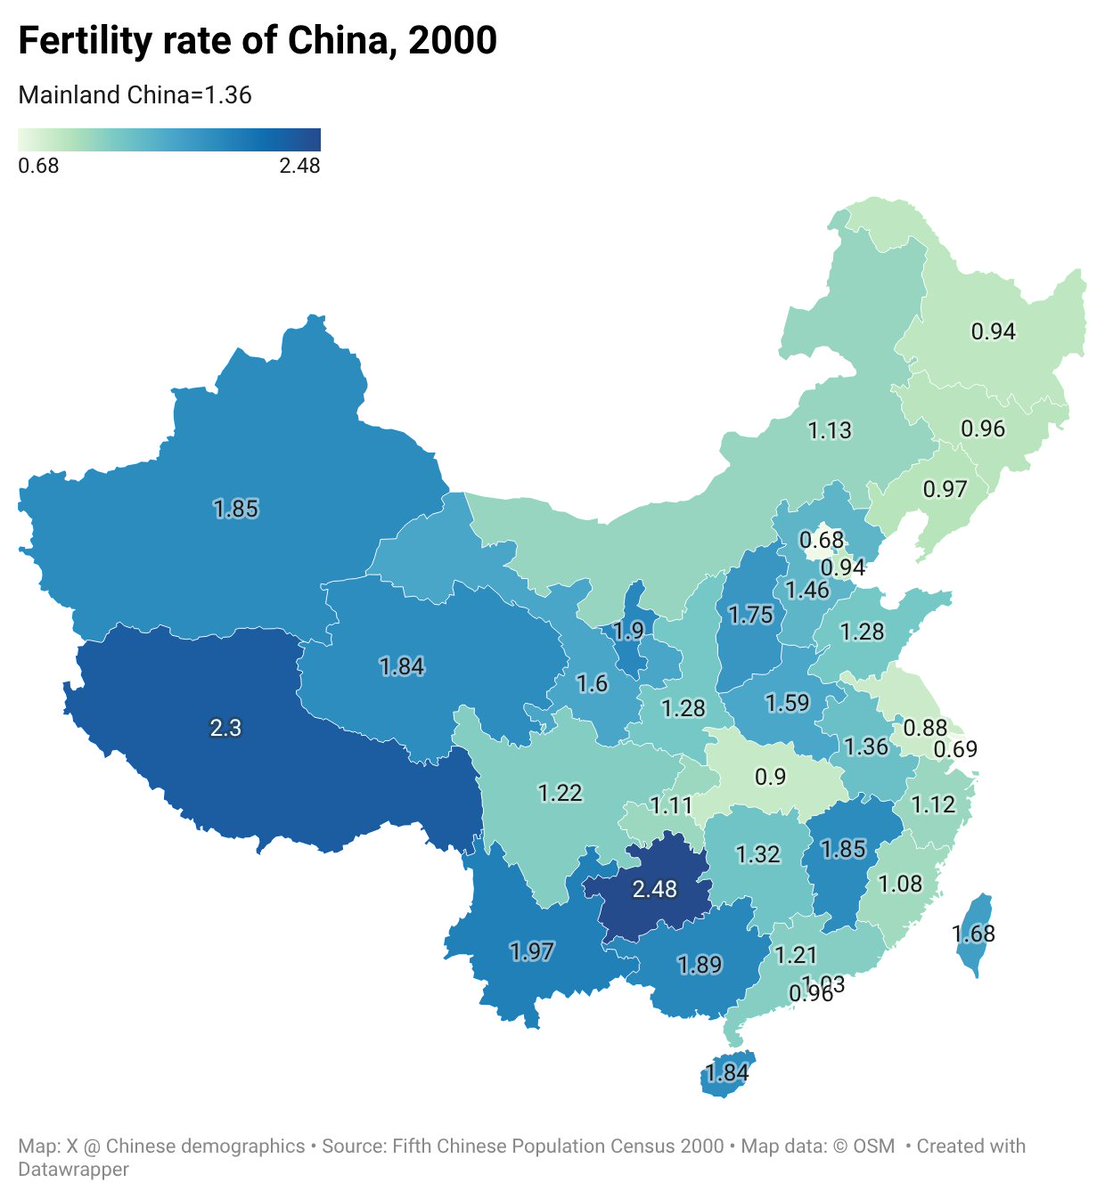
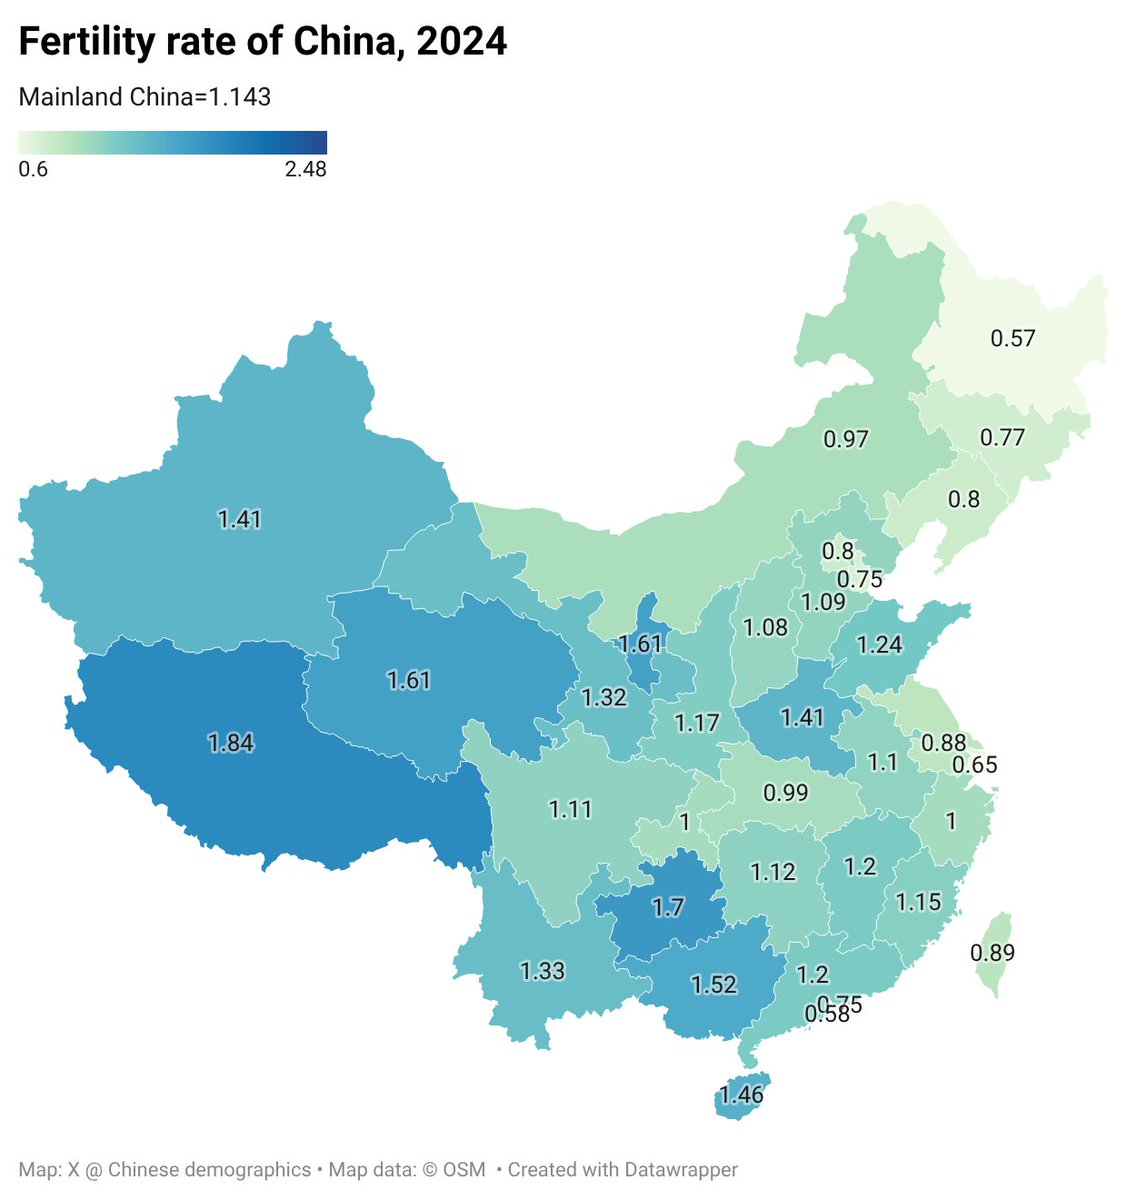
Chinese demographics🇨🇳

128 posts

Chinese demographics🇨🇳

Chinese demographics🇨🇳

@mi233695

Katılım Mart 2024
7 Takip Edilen1.5K Takipçiler
Birth Gauge
Birth Gauge@BirthGauge·
Interim update of the birth table to include the US figures that were released just a few moments ago.
Birth Gauge tweet media
English
16
19
213
22.9K
Chinese demographics🇨🇳
@Divideetimpera5 @andyd10 When the 2000 census is conducted, 13.7M 0-yr-olds were recorded, but the 2020 census showed that there were actually 14.7 M 20-year olds, so around 9-10% of newborns were concealed (If we consider mortality and emigration), and the 1.22 value derives from this underreported data
English
1
1
12
740
Divide et impera
Divide et impera@Divideetimpera5·
@mi233695 @andyd10 I've always been amazed at how different Chinese statistical departments couldn't agree on one common TFR number. The 2000 Chinese census reported a TFR of 1.22, whereas the Family Planning Commission revised the figure significantly higher, up to 1.8
English
3
0
8
813
Chinese demographics🇨🇳
Map of China's Fertility rate, 2000. These values are calculated using the no.of 0 year olds (with underreporting factors eliminated) and the number of 20-44 year old women for each province. Probably quite surprising, but China's Fertility rate was already very low 30 years ago.
Chinese demographics🇨🇳 tweet media
English
14
19
214
16.8K
Chinese demographics🇨🇳
@JohnnyMcnuke I think the main problem is that the design of the Chinese society made that the social status (e.g. convenience, level of respect received) of childbearing mothers is, comparatively, far worse than young, single childless women. The wider this gap is, the lower the TFR.
English
0
0
8
215
Johnny McNuke
Johnny McNuke@JohnnyMcnuke·
@mi233695 Is there a reason why Han populations outside of China proper (Hong Kong, Macao, Taiwan, Singapore, Malaysia) all have such abysmally low birth rates?
English
5
0
4
836
Chinese demographics🇨🇳
@BirthGauge This method simulates fertility without population movement, without population loss, and without changes in fertility patterns. Of course, in reality, all three factors exist, so I don’t claim that the numbers I calculate are perfectly accurate. But this is the best I can do.
English
0
0
12
450
Birth Gauge
Birth Gauge@BirthGauge·
@mi233695 How did you calculate the TFRs? Afaik only crude birth rates were released yet for the provinces.
English
4
0
23
3.3K
Chinese demographics🇨🇳
TFR of Mainland China, 2025, by province. Most provinces plummeted, especially those along the Yangtze Belt. It is noteworthy that Tibet also didn't escape a turbulent decrease. Its no. of births dropped by 19%, causing its TFR to drop below 1.5, and thus surpassed by Guizhou.
Chinese demographics🇨🇳 tweet media
English
20
31
281
34.6K
Chinese demographics🇨🇳
@BirthGauge 3. Then I divide the actual number of births in 2020 + n by the number of births corresponding to a TFR of 1.438, and multiply by 1.438.
English
0
0
6
299
Chinese demographics🇨🇳
@BirthGauge 2. When calculating the fertility rate for 2020 + n (years) , I multiply the fertility rate of women aged x in 2020 by the number of women aged (x − n), to get the number of births in 2020 + n if the TFR remained 1.438.
English
0
0
6
346
Chinese demographics🇨🇳
@BirthGauge My method for calculating the Total Fertility Rate (TFR) is as follows: 1. Take 2020 as the baseline year, using the number of women by age and the age-specific fertility rates in 2020 as the standard. For example, in 2020, Shandong had a total of 853K births, with a TFR of 1.438
English
0
0
18
1.9K
Chinese demographics🇨🇳
@chetellik @JJ_Latvia @BirthGauge Guizhou and Yunnan is only second-tier poor judged by per capita income. And also there is no significant difference between Han and Minorities in the two provinces. Actually, Han is slightly higher in Yunnan.
English
1
0
6
260
Chinese demographics🇨🇳
@ainporram @TheSaxonSong @andyd10 @BirthGauge Idk. Some Uyghur counties saw decrease, some increased. So the overall trend for Uyghurs in 2025 is not yet clear. But the Kazakh TFR was devastated: Ili Prefecture (65% Kazakh) recorded a TFR of 0.82, and mutiple other Kazakh counties all dropped by 20%+. Han is probably fine.
English
2
0
9
536
Chinese demographics🇨🇳
@TheSaxonSong @andyd10 @BirthGauge Probably not. Xizang Autonomous Region is 87% Tibetan. With it dropping to 1.5, Ethnic Tibetan TFR is unlikely to be > 1.6. Furthermore, Gannan (1.55) , Garze (1.32) and Aba (1.28) all have very mediocre TFRs.
English
2
0
8
1.5K
alex
alex@usrnmtaken_·
@mi233695 @MichaelAArouet If this is your map, you should be watermarking all your work from now on and making it clear that people are stealing your work.
English
1
0
2
144
Michael A. Arouet
Michael A. Arouet@MichaelAArouet·
Fertility rates in Chinese provinces. In most areas it’s not a demographic crisis, it’s a demographic collapse. There will be massive economic and geopolitical consequences. Will they be able to reverse the collapse before it’s too late?
Michael A. Arouet tweet media
English
183
249
1.6K
109.3K
Iygine
Iygine@tyqwer16·
🇰🇷 birth registration (not official birth data) 2025 Mar 21,216 2026 Mar 26,402 (+24.4%) Seoul metropolitan 14,493 (+26.4%) Others 11,909 (+22.2%) Birth share of Seoul Metropolitan area : 54.9% 2025 Jan-Mar 64,319 2026 Jan-Mar 73,742 (+14.7%) jumin.mois.go.kr
Iygine@tyqwer16

🇰🇷 birth registration (not official birth data) 2025 Feb 21,225 2026 Feb 22,694 (+7.0%) Seoul metropolitan 12,675 (+10.1%) Others 10,019 (+3.1%) 2025 Jan-Feb 43,103 2026 Jan-Feb 47,340 (+9.8%)

English
16
21
204
62.1K