
Aniruddha Naha
2.4K posts

Aniruddha Naha
@nahaani
CIO- Alternates PGIM India Investing Philosophy: Topline is Vanity, Bottomline Sanity, Cashflows Reality. Tweets are personal views
Mumbai Katılım Nisan 2010
1.1K Takip Edilen1.8K Takipçiler
Aniruddha Naha retweetledi

Stop learning Python like a tutorial addict.
Start thinking like a Computer Scientist. 🧠🐍
I’m giving away Think Python (3rd Edition) – Allen B. Downey
The book that builds real fundamentals, not copy-paste skills.
If you’re serious about mastering Python the right way, this is for you.
To get:
1️⃣ Follow MUST so I can dm
2️⃣ Like + RT
3️⃣ Comment “THINK”
English
@patrick_oshag the cost of capital in 2000 was actually lower. Presently the cost of capital is higher. And the discussion doesnt even talk of the derivatives mountain! #privatecredit #privateequity
Patrick OShaughnessy@patrick_oshag
Paul Tudor Jones says the US is more dependent on equity prices than ever, and explains what a 35% correction would trigger in the economy: "We're 252% of stock market cap to GDP. In 1929 we were 65%. In 1987 we got to ~85-90%. In 2000, 170%. If you think about the periodicity of significant bear markets. Since 1970, we get a mean reversion about every 10 years. Let's say mean revert to the past 25 or 30-year PE. That would be a 30, 35% decline. Well, 35% on 250% of GDP is 80, 90% of GDP. 10% of our tax revenues are capital gains, they go to zero. So you can see the budget deficit blowing up. You can see the bond market getting smoked. You can see this kind of negative self-reinforcing effect. In the stock market, we're over-equitized as a country. We have the highest individual equity weightings in the history of the country. And then the real problem is if you look at private equity in 2007-2008, that was about 7% of institutional portfolios. Now it's about 16% of the institutional portfolios. We're so much more illiquid than we were in 2008. The problem is that if you buy the S&P at this current valuation, the 10-year forward return is negative when you buy the S&P with a PE of 22. That's what history shows. So yes, the S&P is spectacular long-term, if you have a hundred-year view. But that's because that's an average of a hundred years, including times when the S&P 500 PE was 6, 7 and 8, or one third of what it is right now. Valuation matters a lot, and the stock market's really high and it's gonna be really hard to make money from here with any kind of long-term view."
English
@EkanshMittal_KW Company B would anyway be a worthless comoany to look at. With a 400cr equity, if they are generating 25crs EBIT, they might as well put it in an FD. Theoretically, u are right, but in an actual world, no one would pay attention to Company B. Pay off the debt, put it FD
English

Everyone checks Debt/Equity ratio.
Few check Interest Coverage.
Interest Coverage matters MORE.
Here's why:
Interest Coverage = EBIT ÷ Interest Expense
This tells you: Can company pay its interest obligations?
Example:
Company A:
Debt: ₹500 Cr
Equity: ₹300 Cr
Debt/Equity: 1.67x (looks risky)
But:
EBIT: ₹200 Cr
Interest: ₹30 Cr
Interest Coverage: 6.7x ✅
Comfortable. Can pay interest 6.7 times over.
Company B:
Debt: ₹200 Cr
Equity: ₹400 Cr
Debt/Equity: 0.5x (looks safe)
But:
EBIT: ₹25 Cr
Interest: ₹20 Cr
Interest Coverage: 1.25x 🚨
Risky. Barely covering interest.
Company A has MORE debt but BETTER coverage.
Company B has LESS debt but WORSE coverage.
The thresholds:
>5x: Very safe
Company can handle interest easily
3-5x: Comfortable
Reasonable margin of safety
2-3x: Watch zone
Vulnerable if earnings dip
1-2x: Danger zone
One bad year = can't pay interest
<1x: Crisis
Not even covering interest, eating into principal
Why this matters:
Scenario: Economic slowdown
EBIT falls 30%
Company with 6x coverage:
Falls to 4.2x → Still comfortable
Company with 1.5x coverage:
Falls to 1.05x → On the edge of default
Same economic shock. Very different outcomes.
The trend matters too:
Company A:
FY23: Interest Coverage 7x
FY24: 6.5x
FY25: 6x
Stable, slight decline (okay)
Company B:
FY23: Interest Coverage 5x
FY24: 3.5x
FY25: 2x
Deteriorating fast (red flag)
Company B pattern = Profits falling or interest rising (or both).
Cross-check with debt maturity:
High interest coverage + Debt maturing in 1 year = Still risky
(Can they refinance?)
Low interest coverage + Debt maturing in 5 years = Some breathing room
(But still problematic)
Sector context:
Capital-intensive sectors (infra, real estate, power):
Interest coverage 3-4x = Acceptable
Asset-light sectors (IT, pharma, FMCG):
Interest coverage <5x = Question why so much debt?
Where to find:
P&L Statement:
- EBIT (Operating Profit before interest & tax)
- Interest Expense (Finance Costs)
Divide: EBIT ÷ Interest
Track over 3-5 years.
Your framework:
Don't just check Debt/Equity (absolute leverage).
Check Interest Coverage (ability to service debt).
High debt + High coverage = Manageable
Low debt + Low coverage = Risky
It's not about HOW MUCH debt.
It's about CAN THEY SERVICE it.
Context matters.
Research desk → katalystwealth.com
English
FT quote . Confluence of a conflict, global inflation, higher interest rates, growth slowdown and credit risk!
Investors surviving this whirlwind will come out stronger!
#privatecredit #riskoff

English
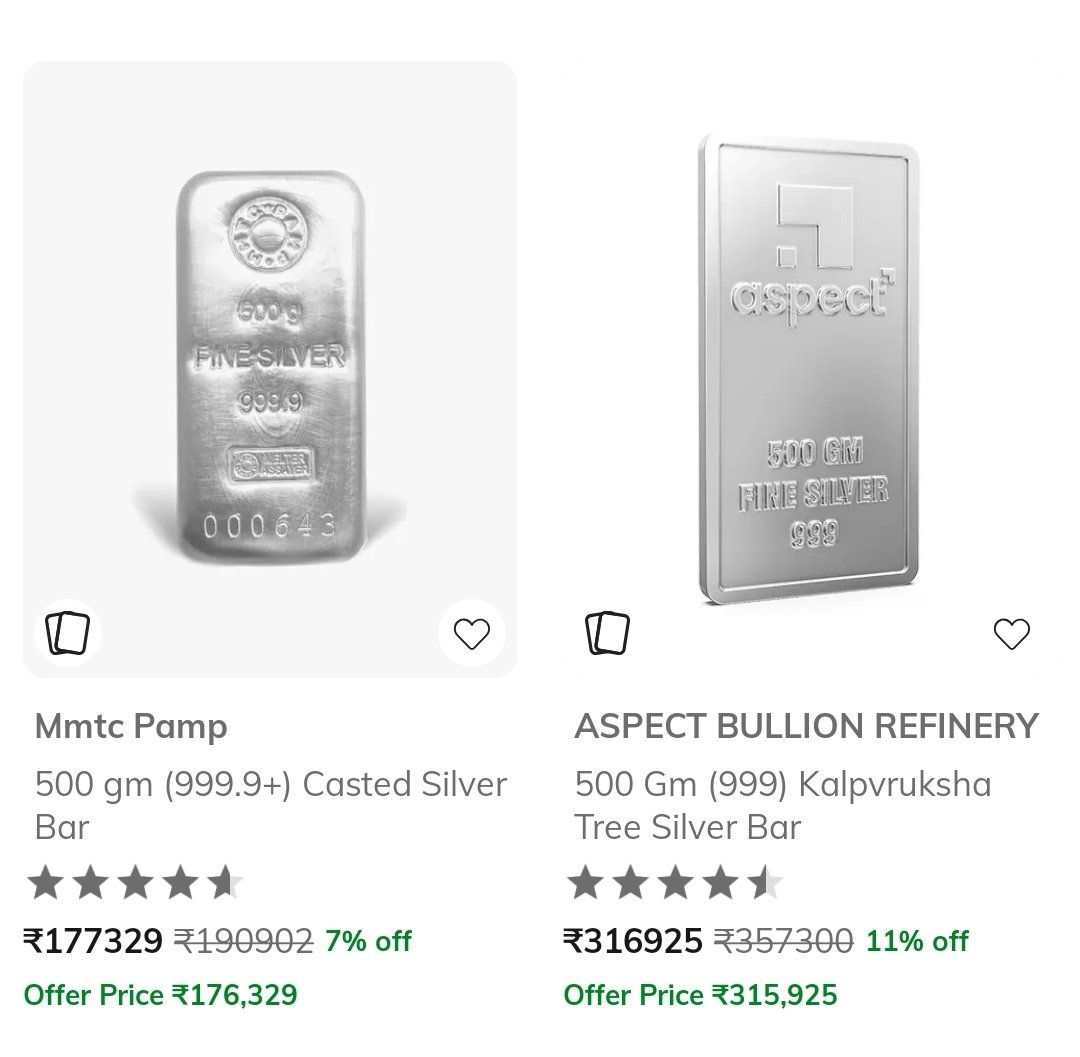
@gnoble79 If liquidity is going to tighten, would gold prices still continue to rise
English


English
An interesting chat with @sonalbhutra on the outlook for Midcap and Smallcaps.
#cnbc
CNBC-TV18@CNBCTV18News
Investing In Volatile Times | Buying Opportunity In Broader Market? Aniruddha Naha, CIO - Alternates of PGIM India Asset Management tells @CNBCTV18News - Midcaps have an earnings growth outlook of 16% in next 3-5 years - Earnings growth outlook for small caps is 22% for next 3-5 years @sonalbhutra @Vivekiyer72 @CNBCTV18News #CNBCTV18Market #Midcap #Smallcap #Investing Watch Here: youtu.be/KLN2ubx0VCM
English
Aniruddha Naha retweetledi

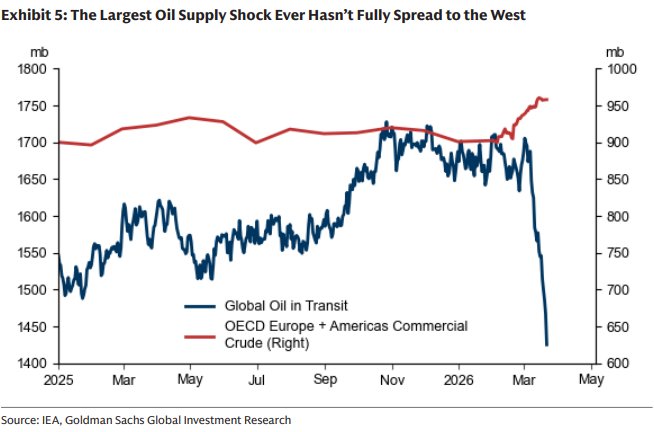
Goldman: The Largest Oil Supply Shock Ever Hasn't Fully Spread to the West
English
Aniruddha Naha retweetledi

$3 Trillion Private Credit Beast: Looks Fine… Until It Doesn’t
“….in an ominous echo of past financial crises, no one is sure just how much banks’ lending exposure to private credit funds could end up costing the financial system and economy in a shake-up.
Estimates vary markedly because there’s no systematic or centralized reporting, no consensus definition of “private credit,” and no way to trace various indirect exposures….
…Estimates for US banks range from just under $100 billion from the Federal Reserve to nearly $300 billion from Moody’s. Once unutilized commitments are included, I wouldn’t rule out a number as high as $1 trillion globally today.
The IMF estimates that US and European banks now carry $4.5 trillion in exposure to non-bank financial institutions, including private credit funds…”
bloomberg.com/opinion/articl…

English
The Middle east will be the cause, #inflation the effect. Inflation is likely to surge and #interestrates cuts are out of the window. One could see rate hikes happening by emerging markets to protect their #currency.
Flat to higher rates will have ramifications in the private #credit markets.

English
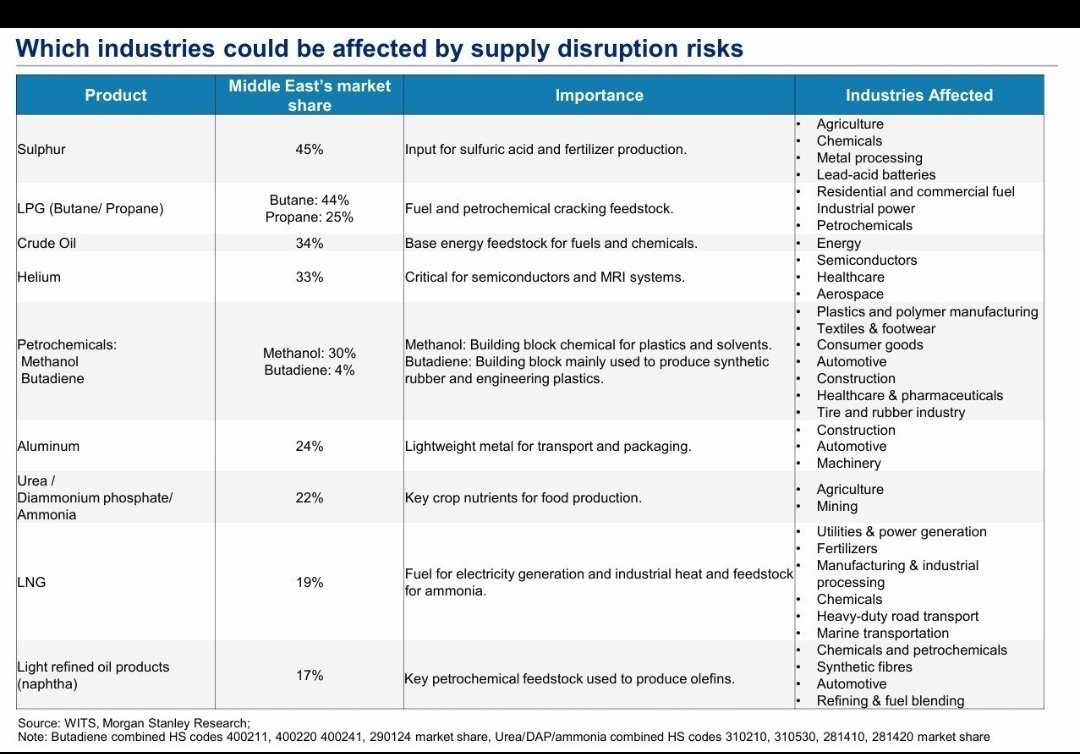
Amazing analysis by @shanaka86 of the diverse fields which get impacted by the disruption of energy value chains.
#Crude #brent and #commodities will probably be the play for the next few years.
Shanaka Anslem Perera ⚡@shanaka86
Seven clocks are running. None of them negotiable. All of them counting down to the same weeks. The planting clock. Mid-April is the biological deadline for corn and soybean planting across the US Midwest. Every day that passes without nitrogen becoming affordable and available narrows the window for corn. USDA projects corn falling to 94 million acres from 98.8 million. Soybeans rising to 85 million from 81.2 million. The seeds that go into the ground in the next three weeks determine America’s grain harvest in October. The decision is irreversible. The USDA clock. March 31. Prospective Plantings. The report that converts farmer intentions into official data. Every acreage number, every corn-soy ratio, every nitrogen-dependent calculation becomes a published fact that traders, governments, and food agencies will use to model global supply for the next twelve months. The number arrives in twelve days. The FAO clock. April 3. The Food Price Index. The first global reading that captures post-Hormuz commodity prices across cereals, vegetable oils, dairy, meat, and sugar. The 2022 peak was 159.7 in March 2022 after Ukraine. This reading will incorporate oil above $100, urea at $610, LNG halted, packaging repriced, and freight surcharges of $500 to $1,500 per container. The number that determines whether the UN declares a food emergency arrives in fifteen days. The pharmaceutical clock. India’s API inventory buffers are two to three months, measured from the war’s onset on February 28. Late May is the depletion window. Methanol at 87.7 percent Hormuz exposure feeds the solvent chain for paracetamol, ibuprofen, metformin, and antibiotics. Once buffers deplete, the shortage becomes a patient access crisis for the 47 percent of US generics that originate in India. The China crude clock. FGE NexantECA confirmed China is drawing commercial reserves at up to one million barrels per day. The draw sustains refinery operations for four to six weeks from March 19. Mid-April to late April is the exhaustion window. After that, China faces three options: accelerate Russian pipeline imports, reroute at massive premium, or crack open the strategic petroleum reserve. The third option reprices every commodity on the planet. The helium clock. SK Hynix and Samsung hold two to three months of helium inventory. Late May to early June is the depletion window. South Korea imports 64.7 percent of its helium from Qatar. Ras Laffan is offline. If helium buffers deplete before alternative supply arrives, semiconductor fabrication faces rationing. The AI hardware supply chain hits a physical wall measured in months, not quarters. The insurance clock. Solvency II requires 30 to 60 days of zero incidents before P&I clubs can reinstate war risk coverage. Even after a ceasefire, the insurance normalisation takes six to sixteen months based on the Red Sea precedent of 26 months and counting. The logistics system lags the financial relief rally by the longest duration of any clock in this crisis. Seven clocks. The shortest expires in twelve days. The longest runs for over a year. The planting window, the USDA report, the FAO index, the drug buffers, the Chinese crude draw, the helium inventory, and the insurance cycle are all counting down simultaneously. None of them pause for diplomacy. None of them respond to presidential directives. None of them read sealed packets. The calendar is the only actor in this war that has never lost a negotiation. open.substack.com/pub/shanakaans…
English

While the market capitalisation break up of the Indian equity market is Largecap, Midcap and #Smallcap, the Small cap is an enormous universe, unlike Midcaps and Largecaps.
Investors can look to build portfolios, depending on return expectation, risk appetite and time frame.

English
If you are into #Hospitality you shouldn't choose your guests, as long as they are happy to pay @purplemartinigo
English
Extremely unprofessional on @purplemartinigo of turning down guests, even though I was ready to pay way higher than the cover charge. Came well ahead of teh #sundowner but they wouldn't give the best seats for more than an hour. Was told to vacate it in one hour.
#Hospitality #avoid
English