Onyx Capital Group

245 posts

Onyx Capital Group banner
Onyx Capital Group

Onyx Capital Group

@onyxcapgroup

Number 1 Liquidity Provider in Oil Swaps

London Katılım Aralık 2021
79 Takip Edilen374 Takipçiler
Mir Mohammad Alikhan
Mir Mohammad Alikhan@MirMAKOfficial·
@najam_ali Najam bhai there is chaos in Spot market. For example 100 buyers and 2 sellers. Rotterdam is in chaos. You are billions percent right. $30+ dollars plus is the lowest premium for Dated Brent today.
English
1
0
20
1.6K
Najam Ali
Najam Ali@najam_ali·
Oil futures are now rapidly converging with physical oil prices. Soaring spot premiums, tightening inventories, rising freight costs, and surging insurance rates are all flashing the same warning: Physical oil is becoming scarce.
English
21
84
619
25.8K
Anton Likhodedov
Anton Likhodedov@ALikhodedov·
@RusOilGasExpert I think Brent here is not DAP Indian ports Brent, but Dated assessment in the North Sea. So Urals is at a small premium to Dated, but below the non-sanctioned physical prices DAP India.
English
3
1
5
2.8K
Russian Oil & Gas Monitor
Russian Oil & Gas Monitor@RusOilGasExpert·
➡️ "Russian Urals crude for delivery ‌to Indian ports in June is trading at a premium of $2–4 a barrel to Brent, down from $6–7 a barrel for May‑delivery cargoes." ➡️ This is a bit theoretical - how much Brent is available for delivery to India? - but still shows how cardinally things have changed for Russian oil sellers since Feb. 28. ➡️ Also, in a Russian Black Sea port and after high transport costs, the Brent-Urals discount is still being reported at >$20/bbl. #oott
Giovanni Staunovo🛢@staunovo

Urals crude premiums ease in India as weak margins curb buying #oott reuters.com/business/energ…

English
3
8
21
5.6K
jck✨
jck✨@Alea_·
🛑 Dated Brent Assessment: $110.75 🛑 Physical differential stays marginally negative
English
1
1
0
326
Javier Blas
Javier Blas@JavierBlas·
As the paper oil market rallies, in the North Sea physical market we have seen today the first trade at a **discount** to the Dated Brent benchmark since the war started. The ironies of the oil market: when plenty (next few days) and dearth (next few weeks) coexist.
English
20
62
520
70.8K
TU_Crypto_News
TU_Crypto_News@TU_Crypto_News·
North Sea physical oil has traded below Dated Brent for the first time since the war began, marking a break in a key wartime pricing pattern. Javier Blas says the move reflects an unusual split: prompt abundance, but tighter supply in the weeks ahead.
English
1
0
0
44
Unabridged John
Unabridged John@UnabridgedJohn·
@JavierBlas Interesting. At the same time, India has supposedly bought WTI at a $10-11 premium over dated Brent for delivery in July.
English
3
0
7
2.2K
Hemisphere Research Capital
Hemisphere Research Capital@hemis_research·
- Brent Crude could spike up above $130-140. Physical dated brent could be much higher with all other middle eastern grades even higher. - US could implement export controls which would send brent soaring further higher. - Potash shortage is already here. So, we are seeing yield of several major crops get cut into 30-40% less than regular yield - this directly leads to food shortage. - Rationing of refined products. - Cost increases of all refined products, and everything linked to transportation - leading to inflation across the board. - Demand destruction due to significantly unreasonable prices -> leading to people buying less, reduced consumer spending -> depreciation of currency This is the overall scenario. If lockdowns are imposed, renewable energy driven power generation is boosted, EV subsidies increased and taxes cut, could boost sentiment and manage the situation. That said, India's grid isn't currently even remotely equipped for such a scenario. This is only if there's a complete halt to the war before June end. The longer this goes, things aren't going to get worse in a linear fashion, but they get worse in an exponential curve.
English
1
0
2
267
Viraj Sheth
Viraj Sheth@viraj_sheth·
can an actual expert shed some light on how bad is the situation at hand here? if the war doesn’t stop, how do things look like 30 days from now? can someone paint a picture.
English
117
23
1.7K
263.1K
Ben White
Ben White@KJeeping14·
Well you look like a dipshit don't you? **Highest reported spot/physical prices last week (May 5–11, 2026) were in the $110–$130+/bbl range for prompt physical/delivered cargoes (especially to Asia/Europe), with benchmarks like Dated Brent and futures mostly $100–$115/bbl. No single public "record" transaction matched April's extremes (e.g., effective all-in costs up to ~$286/bbl in distressed cases like Sri Lanka, mostly for refined products amid Hormuz disruptions).** ### Key Benchmarks and Spot Levels (May 5–11, 2026) - **Brent futures/spot**: Fluctuated significantly. Examples: ~$109–$114 early week (May 5), dropping to ~$100–$104 mid-week, then around $103–$107 by May 11. Intraday highs near $110–$115 in volatile sessions. - **Dated Brent (key physical spot indicator for North Sea crudes)**: Traded in the $100–$120 range, with physical premiums adding to delivered costs. Earlier April peaks saw it near $130–$141, but it moderated by early May. - **WTI (US benchmark)**: Generally $95–$105+/bbl, with physical WTI Midland (popular for export) at premiums of $7–$22+ over Dated Brent for Europe/Asia delivery earlier, though premiums eased somewhat by May. - **Physical/delivered highs**: Asian and European buyers paid the most due to long-haul shipping, insurance, and competition for non-Middle East barrels (e.g., US, Brazilian, African, or limited Gulf cargoes). All-in costs for prompt cargoes likely reached $120–$150+ in tight spots, though specific last-week deals were lower than April's panic levels (physical near $150 reported then). **No new global highest buyer stood out last week**; physical deals are often private and assessed via Platts/Argus. Vulnerable importers in Asia (e.g., long voyages + risk premiums) continued facing the highest effective prices. ### Average Prices Last Week - **Brent crude (approximate weekly average)**: Roughly **$105–$110/bbl**, based on daily closes/settlements (e.g., ~$110 early, dipping toward $100–$104 mid-week, rebounding near $103–$107). Exact weekly average depends on the source (futures vs. spot), but it settled in this band amid volatility from Hormuz-related news and ceasefire hopes. - Broader global spot/physical averages were higher than futures due to quality, location, and delivery premiums (often +$10–$40+ for Asia/Europe). **Context**: Prices remained elevated but eased from April peaks due to partial de-escalation signals, though volatility persisted from geopolitics. Spot markets (physical) diverge from futures—delivered costs include freight/insurance and can be much higher for importers far from supply. For precise real-time deals, consult Platts, Argus, or EIA data. Prices are highly dynamic—check live benchmarks for updates.
English
2
0
1
82
Green Beret Nap Time
Literally everything you said is wrong haha Tariffs were used for better trade deals. Gas prices are far lower than under Biden and oil is at 83.15 today, so gas prices will fall as well. We defeated the Iranian terrorist regime in less than two months. There are literally zero socialist bailouts. The increases in debt are primarily due to required spending that Trump has no control over. You are one of the dumbest people to have ever stolen breath on this earth. Make fun of idiots like this dude all day long.
Levin Inches™@LevinInches

@GBNT1952 Inflation up. Tariffs. Gas prices through the roof. A new middle east war. Socialist bailouts. $2.5 trillion in new Trump debt in a year. Are your parents related to each other, by chance? You literally seem like the dumbest person to ever live.

English
39
80
517
15.1K
Derrick Dao
Derrick Dao@derrick_dao·
Physical-paper basis flipping is the cleanest signal that prompt supply is loose despite the headline rally. Forties and Ekofisk grades typically clear at 50-100c premiums to Dated Brent; trading at a discount means refiners aren't bidding for nearby loadings. The forward curve is rationing, not spot.
English
1
0
0
249
BigBreakingWire
BigBreakingWire@BigBreakingWire·
🇷🇺🇮🇳⚡ Russia’s Urals crude premiums in India fall as refiners cut purchases amid weak margins. Urals crude had surged to a record $5 per barrel premium over Dated Brent in March during the Iran war and after a US sanctions waiver. Reuters reports Indian refiners are now scaling back buying as profitability weakens. IOC led April imports at 670,000 barrels per day. Total Russian oil imports into India dropped nearly 20% from March’s record levels, per ET.
English
1
0
5
492
echt irre
echt irre@echt_irre·
PS Meanwhile there's so much decoupling of paper markets from real markets, that there's a large price gap between paper-prices and physical prices (eg Brent versus dated Brent or physical gold and silver vs paper-gold and - silver). Thought to the end paper-money is...
English
2
0
1
115
echt irre
echt irre@echt_irre·
Money has to go somewhere. If you sell bonds you should invest into some other liquid asset. Bonds got a risky asset due to rising yields worldwide. Paper gold is risky bc there's too much paper compared to physical gold. Commodities (oil) are risky. So stocks are the only...
石原順(西山孝四郎)@ishiharajun

日本は円安を食い止めるために米国債を売却している可能性があり、これにより米国の債券市場への圧力がさらに高まり、米国の借入コストが上昇している。

English
1
0
3
91
gaurav
gaurav@gnagpal1981·
If physical Dated Brent is printing $144 while Dec-26 futures are ~$80, what’s the realistic timeline for that spread to compress? Are we talking weeks of sustained high physical until more tankers actually move, or could this backwardation persist into Q3 even if a few more ships get through?”
English
2
0
0
68
PSI Capital
PSI Capital@psi_cap·
The "0/5" Ceasefire: Why oil remains firm despite the headlines. ❌ Everyone is waiting for the "relief rally," but the physical reality of the Strait is a $144 barrel. From fuel rationing in South Asia to the collapse of the "spare capacity" myth, the invoice has left the barrel. While paper traders chase "peace" rumors, the global energy system is undergoing a violent structural shift. Here is the 4-part PSI Capital framework you need to understand this crisis: 1. The Ceasefire Mirage Market sentiment sells off on every "peace" headline, but the actual impact on the oil system is 0/5. The corridor hasn’t healed. Political wins are not commercial fixes—the Strait remains a gauntlet of mines, military tolls, and blockades. Don't trade the noise while the physical world is still on fire. 2. The $50 Physical-to-Paper Spread 📈 We are seeing a total breakdown in the pricing mechanism. • Dated Brent: $144.42 (Record High) • Dec-26 Futures: ~$80 A $50 gap between today’s barrel and the future is unprecedented. Futures reflect "hope," but physical buyers are paying for "survival." The physical market always wins the tug-of-war. 3. The "Spare Capacity" Myth 🛑 The market is looking at the wrong number. While the headline spare capacity sits at 5+ mb/d, the reality is that only ~1.5 mb/d can actually be delivered to a ship. If the oil is trapped behind a blockade or the new "Iran Toll Authority," it functionally doesn't exist. The global cushion is far thinner than your terminal suggests. 4. The Invoice is Already Downstream 🧾 Crude prices are just the starting gun. The bill has already moved through the chain and is hitting the global economy where it hurts: • Transport: Airlines are struggling with non-pass-through fuel costs. • Food: Fertilizer spikes are driving "shrinkflation" to its breaking point. • Currencies: EM nations are burning through FX reserves just to keep the lights on. The Facts on the Ground (May 10, 2026): ⚠️ Fuel rationing is now active across South Asia. ⚠️ The UAE has officially exited OPEC, shattering the "unity" narrative for good. ⚠️ US Naval escorts have become the mandatory baseline for transit. Bottom Line: Watch the system, not the headlines. The framework hasn’t changed; the evidence has only strengthened. The stress isn't "coming"—it is here. Read the full analysis and the series so far: 🔗 psicapital.substack.com #OilPrice #Macro #OPEC #EnergyCrisis #Brent #StraitOfHormuz #Inflation #FinTwit #EnergySecurity #Commodities #OilAndGas #EconomicOutlook2026 #PSIwaves #MarketAnalysis
PSI Capital tweet media
English
4
2
4
104
Next Quantitative Research
Fact 3: 4 more weeks = demand destruction, not empty tanks World Bank escalation scenario: Brent → $115-130. Dated Brent physical already peaked at $144. The hidden crisis: Fertilizers. Nature: Urea +46% in one month. 360M people face acute food insecurity (WFP). Heat pump sales EU Q1: +17% (DE/FR/PL +25%). Markets adapt faster than policy.
English
2
0
0
70
Next Quantitative Research
🧵 How long can the global oil system hold if the Hormuz blockade continues for 4 more weeks? We analyzed data from JP Morgan, IEA, World Bank, EIA, and OilPrice. The answer is more nuanced than "we're running out of oil" — but no less concerning. Our analysis, not financial advice. 🦅
English
1
1
1
55
Ashenden Finance
Ashenden Finance@AshendenFinance·
Price of physical oil cargoes is plunging as buyers pull back after last month’s bidding frenzy. An easing that began in 2nd half of April accelerated in the last week, with premiums of major North Sea grades, used to set Dated Brent, falling up to 90% to almost pre-war levels
Ashenden Finance tweet media
English
1
0
2
95
Anton Likhodedov
Anton Likhodedov@ALikhodedov·
Different closing times. Dated is assessed at 16.30, futures were lower than Dated then. but yes, physical premiums weakened a lot vs 3-4 weeks ago. Here is a good post and discussion in comments on why this happened x.com/CRUDEOIL231/st… Also would highlight again @OilCfd point that part of the reason premiums reached $23+ early April (which resulted in $30+ difference between Dated and futures and over $40 difference between futures and immediately loading barrels - remember Forties grade near $150) - was ... well ... games in the Dated window. Lightly regulated physical market allows participants to load up on derivatives (e.g. CFDs for Brent or Dubai swaps - in Dubai market) and then trade physical market that sets these derivatives (Dated Brent window or physical cargoes 2 mo forward in Dubai). Sure, bidding up cargoes to ridiculous levels would lose you money, but you will make more than that on your derivative leg (assuming it is larger than the physical amount you buy). This is not something rates/FX guys anticipate - esp. after a huge crackdown post GFC, but with much lighter regulation and also with ability of big traders who move several million barrels every day to justify pretty much any physical activity it is not that rare in the oil market. The biggest example of that was Dubai physical premiums story: bloomberg.com/news/articles/…
Joumanna Nasr Bercetche@JoumannaTV

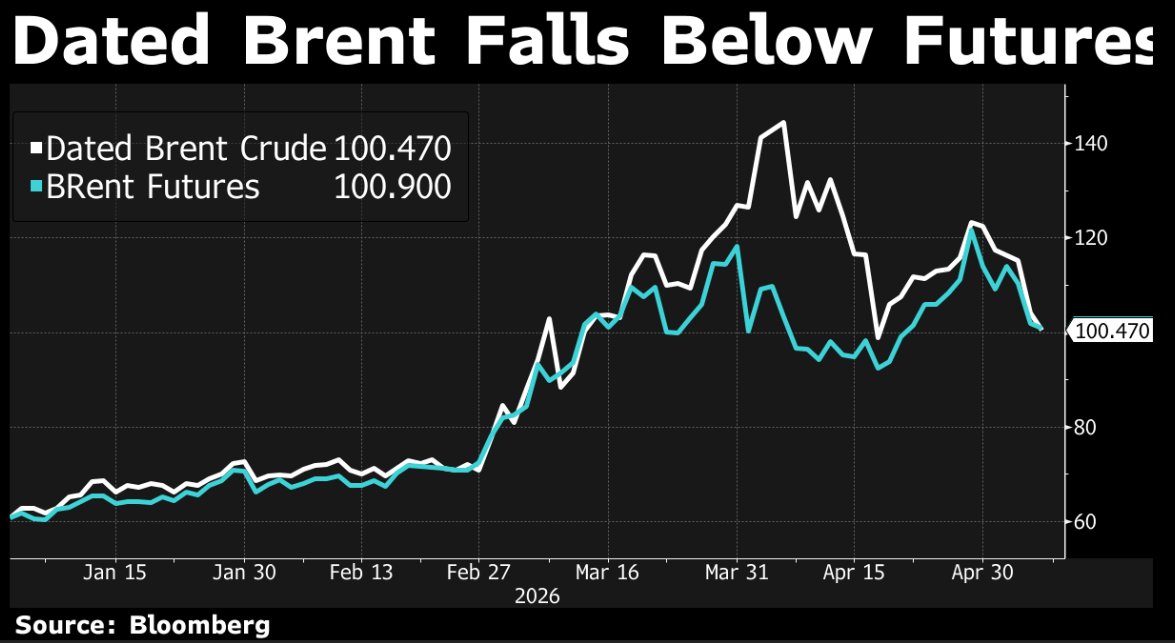
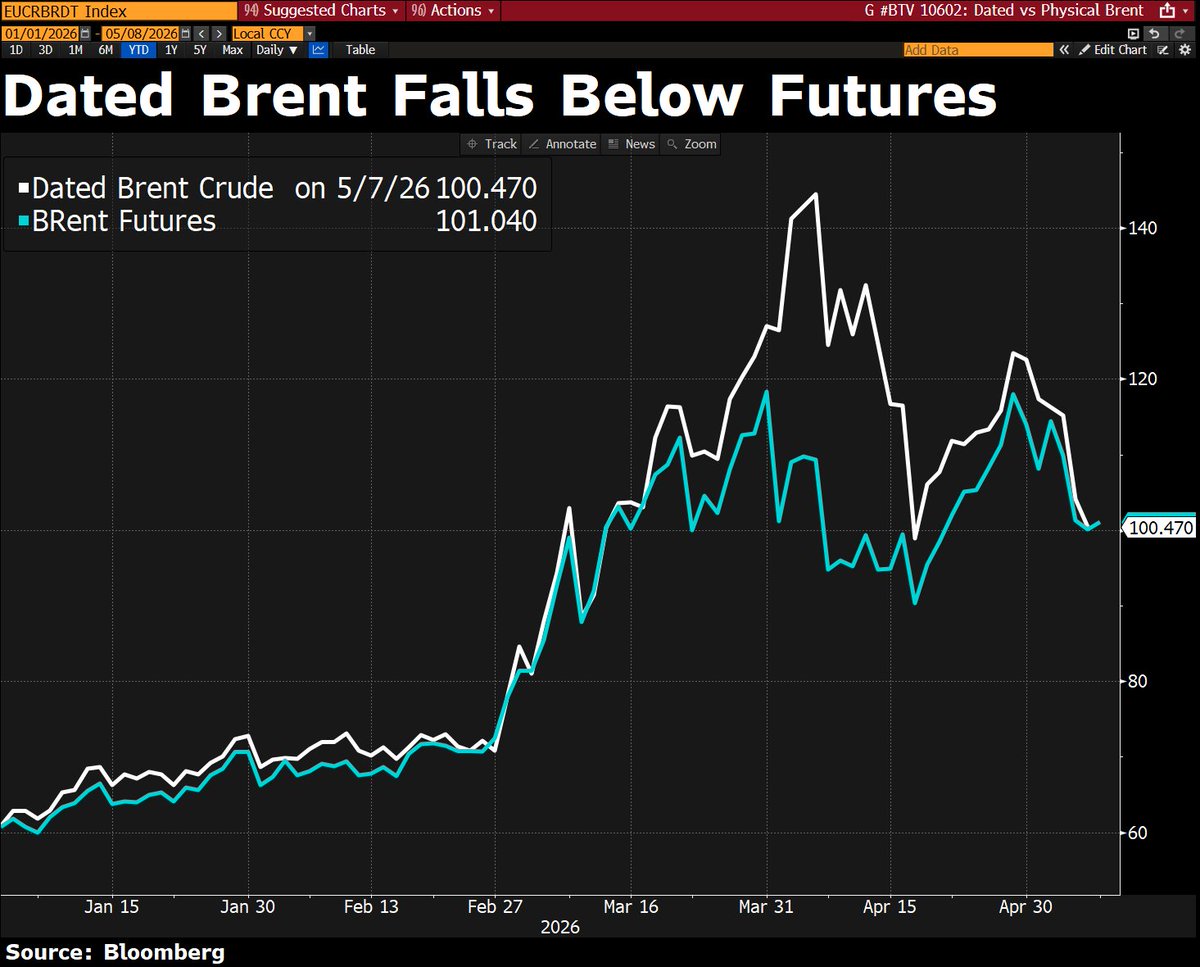
!! Interesting. Dated Brent (physical market) has fallen *below* futures #OOTT

English
6
7
63
12.6K
Javier Blas
Javier Blas@JavierBlas·
CHARTS OF THE DAY: Rightly or wrongly, the physical oil market has turned around (📉⤵️). Other physical datapoints (early May vs mid Apr): WTI is down to +$2.5 to Dated Brent from +$22 CPC is down to -$0.35 to Dated from +$7 Dalia (a Chinese fav) is now -$2 to Dated from +$10
Javier Blas tweet media
English
24
50
251
56.1K
Michel Gubel
Michel Gubel@Mgubel·
@aeberman12 But front-dated brent is down? Shouldnt this suggest lower prices ?
Michel Gubel tweet media
English
1
0
1
2.6K
Robin Brooks
Robin Brooks@robin_j_brooks·
The spread between Dated Brent and the July futures price is back to pre-war levels. The same people who one month ago told us this thing can only go wider are still forecasting the apocalypse. Maybe they're right, but their recent track record isn't good. robinjbrooks.substack.com/p/debunking-mo…
Robin Brooks tweet media
English
22
10
56
18.3K