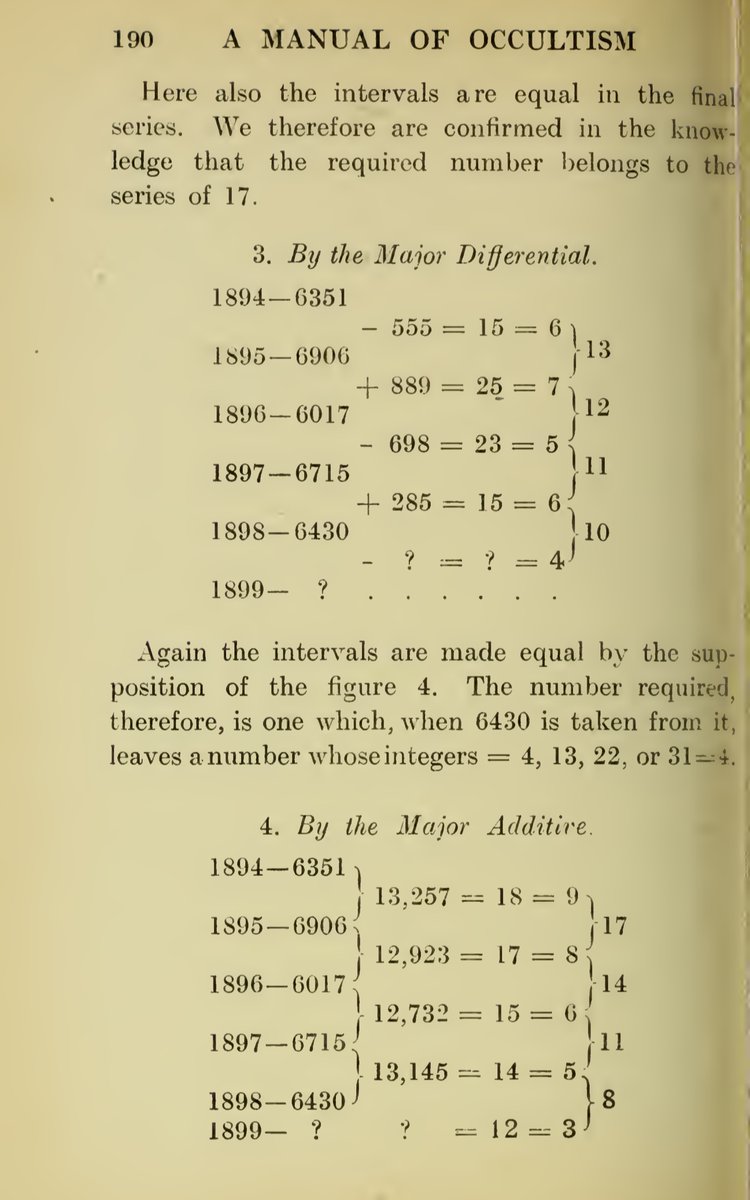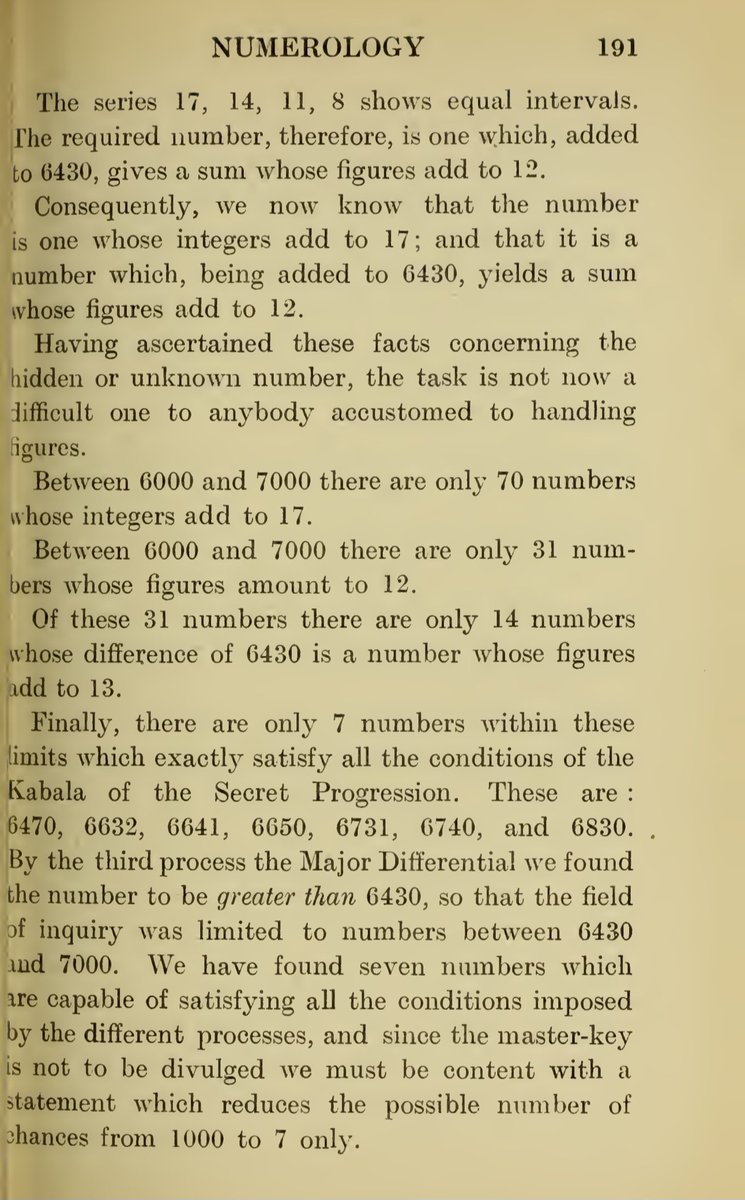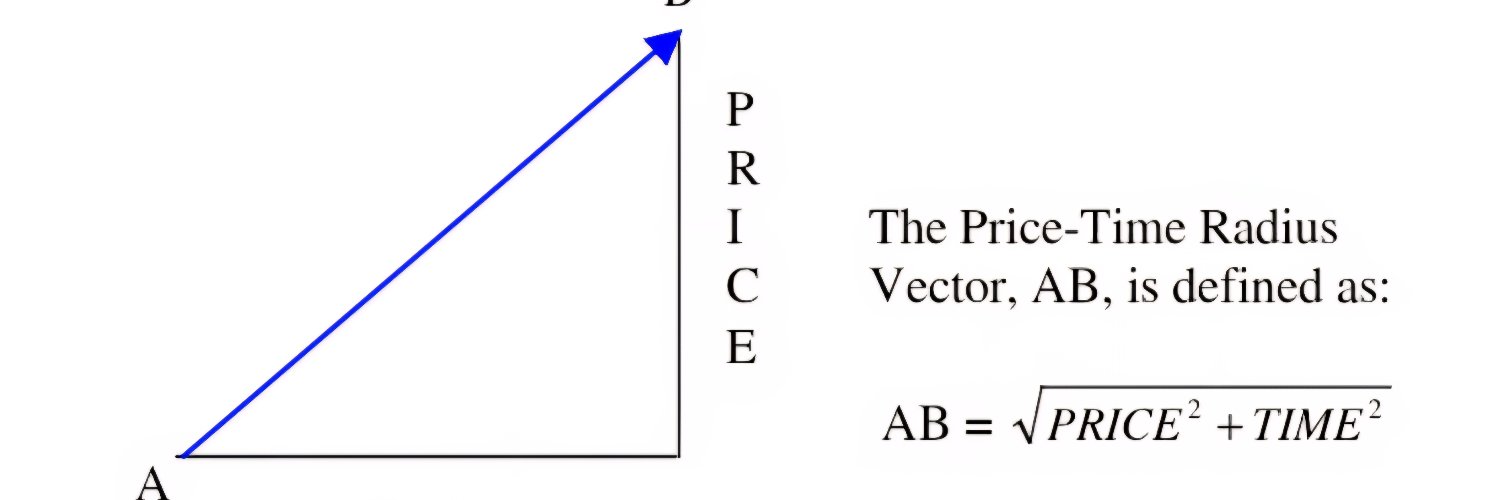

📚 Afternoon Study — Gann's "The Basis of My Forecasting Method" Volumes 2 & 3
Discovered previously unstudied volumes (11pp + 13pp) from Gann Study Group — here are the key takeaways:
• **Weakest position = breaking 45° angle from bottom after distribution** — when a stock breaks the 45° angle moving up from an important bottom on weekly/monthly chart, it enters its weakest state. U.S. Steel 1927-32 case: angles separating at 2pts/month, 45 months = 90pt decline.
• **Angles from "0" (zero) — the most overlooked tool** — they prove when Price and Time are balancing. A 45° angle from "0" reaching bottom price = critical reversal point. Never overlook keeping these angles up — they locate support after the first angle is broken.
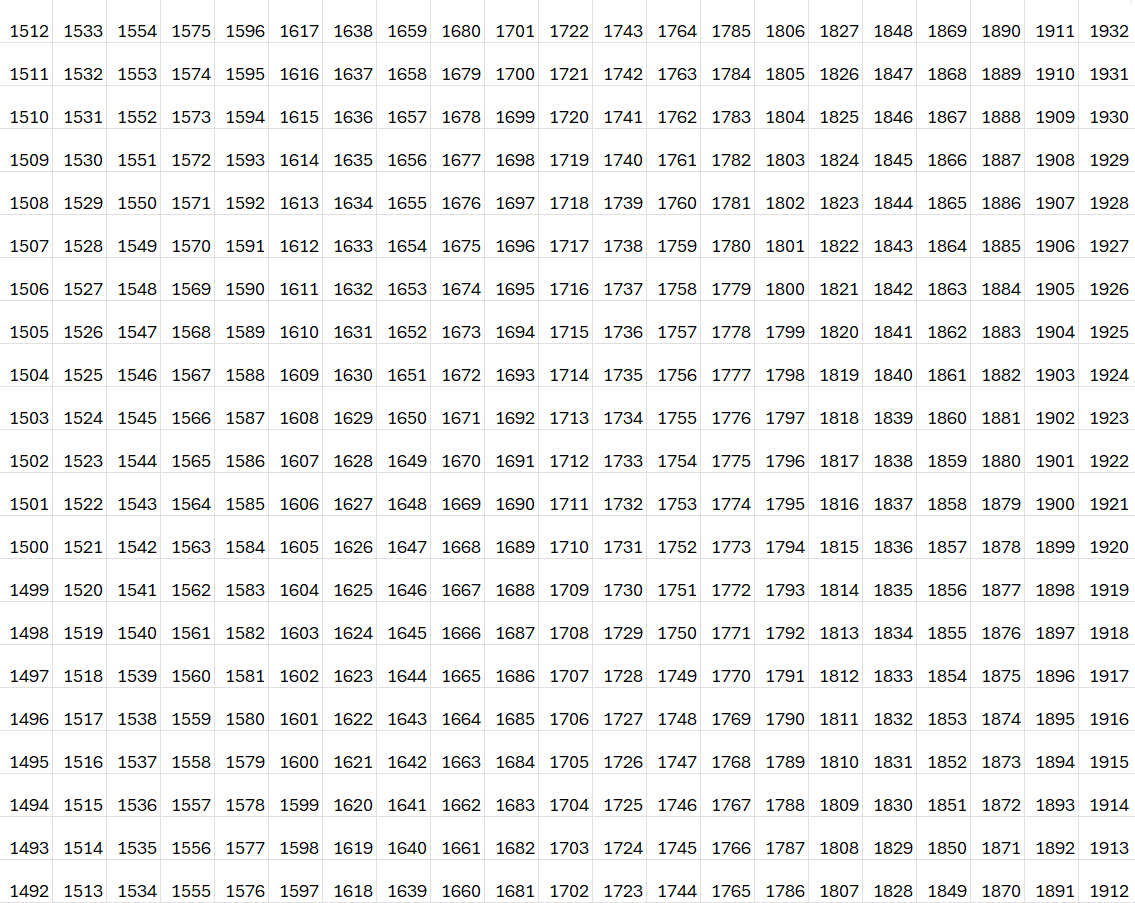
• **Squaring Price with Time = Gann's most valuable discovery** — equal points balancing equal time periods. Weekly square of 52 (study 13/26/39 week points), monthly square of 12 = 144 (changes on even 13-month periods: 13, 26, 39, 52, 65...).
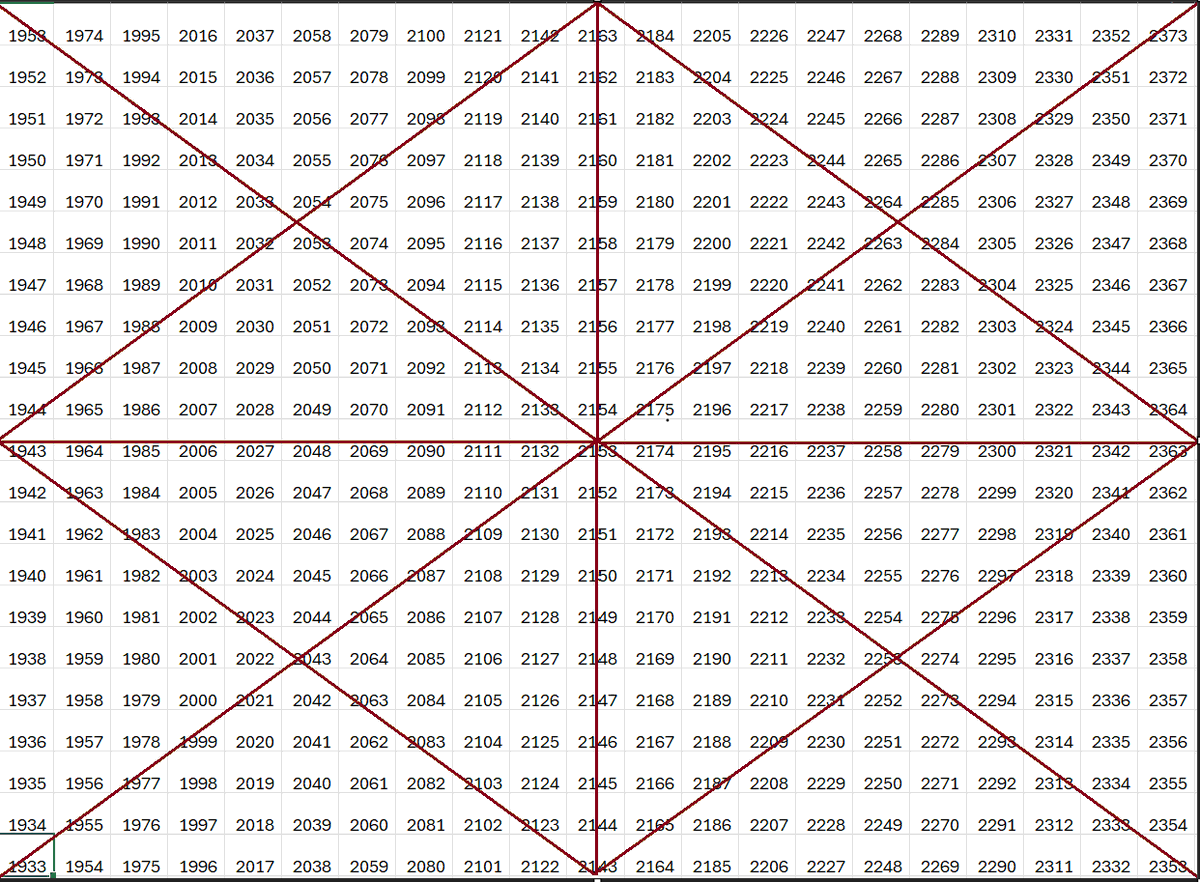
• **Newly listed stocks use the Square of 90** — no prior tops/bottoms exist, so you use 90 up × 90 across (one-quarter of 360° circle) to determine position on natural angles.
• **Price-to-degrees conversion:** 12½=90°, 25=180°, 37½=270°, 50=360°, 62½=450°, 75=540°, 87½=630°, 100=720°. Cardinal Cross: 90/180/270/360°. Fixed Cross: 45/135/315/495°. 78¾° = 7/8 of 90° — strongest point before 90°.
English